arrow-left

Only this pageAll pages
gitbookPowered by GitBook
1 of 92

Fawry cloud devops internship

Loading...

Loading...

Loading...

Loading...

Loading...

Loading...

Loading...

Loading...

Loading...

Loading...

Loading...

Loading...

Loading...

Loading...

Loading...

Loading...

Loading...

Loading...

Loading...

Loading...

Loading...

Loading...

Loading...

Loading...

Loading...

Loading...

Loading...

Loading...

Loading...

Loading...

Loading...

Loading...

Loading...

Loading...

Loading...

Loading...

Loading...

Loading...

Loading...

Loading...

Loading...

Loading...

Loading...

Loading...

Loading...

Loading...

Loading...

Loading...

Loading...

Loading...

Loading...

Loading...

Loading...

Loading...

Loading...

Loading...

Loading...

Loading...

Application Architecture

Loading...

Loading...

Loading...

Loading...

Loading...

Loading...

ZiSoft Deployment

Loading...

Loading...

Loading...

Loading...

Loading...

Loading...

Loading...

Loading...

Loading...

Docs

Loading...

Loading...

Loading...

Loading...

Loading...

Loading...

Loading...

Loading...

Loading...

Loading...

Loading...

Loading...

Loading...

Loading...

Loading...

Loading...

Application production deployment architecture

hashtag
Recommended Application HW Sizing

Deployment Architecture

Role
VM specs
Software
No. of VM
circle-info

Note : Take daily snapshots of Media store server and Database server

Kubernetes PV & PVC

Previously in this series, we looked at in Kubernetes. Now we’ll take a step further and introduce two other Kubernetes objects related to data persistence and preservation, namely PersistentVolumes (PVs) and PersistentVolumeClaims (PVCs).

We’ll cover the following topics, including hands-on practice on the functionalities of these concepts:

  • What are PersistentVolumes and PersistentVolumeClaims?

Application Server Production

vCPU : 16 core RAM : 64 GB Volume: 200 GB SSD OS: Ubuntu 22.04 LTS

Nginx Kubernetes 1.27 Containerd

3 VM

Database Server

vCPU : 16 core RAM : 64 GB Volume: 400 GB SSD OS: Ubuntu 22.04 LTS

MySql 8.0

1 VM

Staging Server

vCPU : 4 core RAM : 16 GB Volume: 200 GB OS: Ubuntu 20.04 LTS

Nginx Kubernetes 1.27 Containerd mysql 8.0

1 VM

How and by whom are PersistentVolumes defined?
  • How do PersistentVolumes differ from Volumes?

  • How are PersistentVolumes and PersistentVolumeClaims created?

  • How and by whom is persistent storage requested using PersistentVolumeClaims?

    • Relationship between PV , PVC and Storage Volume

    • Static provisioning

    • Dynamic Provisioning

    • hashtag
      Kubernetes PersistentVolumes (PVs) and PersistentVolumeClaims (PVCs)

      Storage management is essential in Kubernetes, especially in large environments where many users deploy multiple Pods. The users in this environment often need to configure storage for each Pod, and when making a change to existing applications, it must be made on all Pods, one after the other. To mitigate this time-consuming scenario and separate the details of how storage is provisioned from how it is consumed, we use PersistentVolumes (PVs) and PersistentVolumeClaims (PVCs).

      A PersistentVolume (PV) in Kubernetes is a pool of pre-provisioned storage resources in a Kubernetes cluster, that can be used across different user environments. Its lifecycle is separate from a Pod that uses the PersistentVolume.

      A PersistentVolumeClaim (PVC), is a process of storage requests from PVs by the users in Kubernetes. Kubernetes binds PVs with the PVCs based on the request and property set on those PVs. Kubernetes searches for PVs that correspond to the PVCs’ requested capacity and specified properties, so that each PVC can bind to a single PV.

      When there are multiple matches, you can use labels and selectors to bind a PVC to the right or a particular PV. This helps guard against a situation where a small PVC binds to a larger PV, since PVs and PVCs have a one-to-one relationship. When this happens, the remaining storage in the bound PVs are inaccessible to other users.

      NOTE: Both the PVCs and the Pod using them must be in the same namespace.

      hashtag
      The Difference Between PVs and PVCs in Kubernetes

      PVs and PVCs differ in provisioning, functionalities, and the person responsible for creating them, specifically :

      • PVs are created by the cluster administrator or dynamically by Kubernetes, whereas users/developers create PVCs.

      • PVs are cluster resources provisioned by an administrator, whereas PVCs are a user’s request for storage and resources.

      • PVCs consume PVs resources, but not vice versa.

      hashtag
      Difference between Volumes and PersistentVolumes

      Volumes and PersistentVolumes differ in the following ways:

      • A Volume separates storage from a container but binds it to a Pod, while PVs separate storage from a Pod.

      • The lifecycle of a Volume is dependent on the Pod using it, while the lifecycle of a PV is not.

      • A Volume enables safe container restart and allows sharing of data across containers, whereas a PV enables safe Pod termination or restart.

      hashtag
      PersistentVolumes and PersistentVolumeClaims Lifecycle

      The communication between PVs and PVCs consists of the following stages:

      • Provisioning: This is the process of creating a storage volume, which can be done statically or dynamically.

        • Static: The static way of provisioning a storage volume is when PVs are created before PVCs by an Administrator and exist in the Kubernetes API, waiting to be claimed by a user’s storage request, using PVC.

    • Binding: When an Administrator has provisioned PVs and users make a specific amount of storage requests (PVCs), a control loop in the master finds a matching PV and binds them together. If a matching volume does not exist, the claim will remain unbound until a volume match is created.

    • Using: Pods use claims as volumes. The Kubernetes API checks the claim to find a bound PV and mounts it in the Pod for the users. When a claim is already bound to a PV, the bind remains unchanged as long as the user wants it. So user A’s bound PV can not be taken over by user B, if it is still in use by user A.

    • Reclaiming: When a user is done with the volume usage, the resources must be freed up by deleting the PVC objects from Kubernetes. This practice will free the PV from the PVC, allowing reclamation of the resources, making it available for future use. What happens to the volumes afterwards is determined by the PersistentVolumeReclaimPolicy (PVRP) value specified in the configuration file. The PVRP provides three options of what you can do to a PersistentVolume after the claim has been deleted: retain, delete, or recycle.

      • Retain: This is the default reclaim policy. It is a process that allows manual deletion of the PV by the Administrator. When a PVC is deleted, the PV remains intact, including its data, thus making it unavailable for use by another claim. However, the Administrator can still manually reclaim the PersistentVolume.

      • Delete: When the reclaim policy is set to delete, the PV deletes automatically when the PVC is deleted and makes the space available. It is important to note that the dynamically provisioned PVs inherit the reclaim policy of their StorageClass, which defaults to Delete.

    hashtag
    How to Create a PersistentVolume

    The following steps will guide you through how to create a PersistentVolume and how to use it in a Pod. Before continuing, it is imperative to have a basic knowledge of volume, volumeMounts, and volume typesarrow-up-right such as hostPath, emptyDir, among others, in order to effectively follow this hands-on practice. A running Kubernetes cluster and a kubectl command-line tool must be configured to talk to the cluster. If you do not have this, you can achieve this by simply creating a Kubernetes cluster on any environment with KubeOnearrow-up-right. Refer to Getting Startedarrow-up-right for instructions. Alternatively, you can go to the Kubernetes playgroundarrow-up-right to practice. In that case, you might also need a cloud provider (GKE, AWS, etc.) access or credentials to provision storage.

    Follow the below steps to create a PersistentVolume:

    Step 1: Create the YAML file.

    Step 2: Copy and paste the below configuration file into the YAML manifest file created above.

    The configuration above shows properties with different functionalities. In addition to the properties from the previous Kubernetes objects exercises, let’s look at accessModes, capacity, and storage properties:

    • accessModes: This property defines how a PV should be mounted on the host. The value can be ReadWriteOnce, ReadOnlyMany, or ReadWriteMany. Below is a basic description of these values:

      • ReadWriteOnce: You can mount the PV as read-write by a single node.

      • ReadOnlyMany: You can mount the PV as read-only by multiple nodes.

      • ReadWriteMany: You can mount the PV as read-write by multiple nodes.

    • capacity.storage: This property is used to set the amount of storage needed for the volume.

    Step 3: Create the Persistent Volume using kubectl create command.

    Step 4: Check the created PV to see if it is available.

    Step 5: Check the description of the PersistentVolume by running kubectl describe command.

    As seen above, the PersistentVolume is available and ready to serve a PVC storage request. The status will change from available to bound when it has been claimed.

    NOTE: It is not advisable to use the hostpath volume type in a production environment.

    hashtag
    How to Create a PersistentVolumeClaim in Kubernetes

    Now that the PersistentVolume has been successfully created, the next step is to create a PVC that will claim the volume. Creating a PersistentVolumeClaim is similar to the method used to create the PersistentVolume above, with a few differences in terms of its properties and values. The value of the kind property will be PersistentVolumeClaim. The resources.request.storage field will also be added, and the value will be the provisioned PV capacity value (so 3Gi in our case).

    The configuration will look like the manifest file below:

    Step 1: Create a YAML file.

    Step 2: Copy and paste the above configuration file into the YAML file created above.

    Step 3: Create the PVC by running kubectl create command.

    Step 4: Check the status of the PVC by running kubectl get command.

    Step 5: Check the description of the PVC.

    As shown above, the status indicates a “Bound” state, which means the PVC and PV are now bound together. Now, check the status of the PV once again with kubectl get command.

    The output shows that the status has changed from “available” when it is not yet bound to “Bound” because the PV has been claimed by the created PVC.

    Step 6: Delete the PVC using kubectl delete command.

    Step 7: Check both the PVC and PV status with kubectl get command.

    The output shows that the PV status has now changed from a “Bound” to a “Released” state, after the PVC is deleted.

    hashtag
    PersistentVolumes States

    A PV has different states, can be in any of these, and each has its own meaning, described as follows:

    • Available: The PV is free and not yet claimed or bounded.

    • Bound: The PV has been claimed or bounded.

    • Released: The bounded PVC has been deleted, and the PV is free from its previous bounded state.

    • Failed: The PV has failed its automatic reclamation.

    hashtag
    PersistentVolumeClaims States

    Each PVC, like the PV, has its own states that represent its current status.

    • Bound: The PVC is bound to a PV.

    • Pending: The PVC can not bind to a PV. This could be due to a higher storage request than the PV capacity, or the PV accessMode value is different from that of the PVC, etc.

    hashtag
    How to Use PersistentVolumeClaim in a Pod

    A Pod can access storage with the help of a PVC, which will be used as a volume. PVC can be used in a Pod by first declaring a “volumes” property in the Pod manifest file and specifying the claim name under the declared volume type “persistentVolumeClaim” property. It is essential that both the PVC and the Pod using it exist in the same namespace. This will allow the cluster to find the claim in the Pod’s namespace and use it to access the PersistentVolume that is bound to the PVC. Once created, the applications in the containers can read and write into the storage.The complete configuration file will look like this:

    The below steps will guide you through how to use a claim in a Pod. The PV and PVC have to be provisioned before creating the Pod. The claim name inside the Pod must also match the claim name in the running PVC.

    Step 1: Create a YAML file.

    Step 2: Copy and paste the above Pod manifest file into the YAML file created above and create the Pod with kubectl create command.

    Step 3: Check the status and the description of the Pod.

    Step 4: Exec into the Pod to test the PVC use case.

    Step 5: Use df -h together with the path to confirm the mount point.

    Step 6: Change into the mount directory and create a file using echo command.

    Step 7: Check the created file and data using ls and cat commands, then exit the Pod once this has been confirmed.

    Step 8: Delete and recreate the Pod.

    Recreate the Pod and check the status:

    Step 9: Exec into the Pod and check the previous file and data created if they exist in the new Pod.

    You can see that the file and data created in the deleted Pod above are still there and were taken up by the new Pod.

    Summary: PersistentVolumes and PersistentVolumeClaims are Kubernetes objects that work in tandem to give your Kubernetes applications a higher level of persistence, either statically or dynamically, with the help of StorageClass.

    volumes and volumeMountsarrow-up-right
    $ vim pv-config.yaml
    apiVersion: v1
    kind: PersistentVolume
    metadata:
      name: my-volume
    spec:
      capacity:
        storage: 3Gi
      accessModes:
        - ReadWriteOnce
      hostPath:
        path: "/app/data"
    $ kubectl create -f pv-config.yaml
    persistentvolume/my-volume created
    $ kubectl get pv
    
    NAME       CAPACITY   ACCESS MODES   RECLAIM POLICY  STATUS     CLAIM    STORAGECLASS      REASON      AGE 
    my-volume    3Gi       RWO              Retain       Available                         ⠀⠀⠀⠀⠀⠀⠀⠀⠀⠀⠀⠀⠀ 60s
    $ kubectl describe pv my-volume
    
    Labels:          <none>
    Annotations:     <none>
    Finalizers:      [kubernetes.io/pv-protection]
    StorageClass:
    Status:          Available
    Claim:
    Reclaim Policy:  Retain
    Access Modes:    RWO
    VolumeMode:      Filesystem
    Capacity:        3Gi
    Node Affinity:   <none>
    Message:
    Source:
        Type:          HostPath (bare host directory volume)
        Path:          /app/data
        HostPathType:
    Events:            <none>
    apiVersion: v1
    kind: PersistentVolumeClaim
    metadata:
      name: my-claim
    spec:
      accessModes:
        - ReadWriteOnce
       resources:
          requests:
            storage: 3Gi
    $ vim pvc-config.yaml
    $ kubectl create -f pvc-config.yaml
    persistentvolumeclaim/my-claim created
    $ kubectl get pvc my-claim
    
    NAME       STATUS     VOLUME      CAPACITY   ACCESS MODES   STORAGECLASS   AGE
    my-claim   Bound    my-volume       3Gi           RWO                      7m
    $ kubectl describe pvc my-claim
    
    Name:          my-claim
    Namespace:     default
    StorageClass: 
    Status:        Bound
    Volume:        my-volume
    Labels:        <none>
    Annotations:   pv.kubernetes.io/bind-completed: yes
                   pv.kubernetes.io/bound-by-controller: yes
    Finalizers:    [kubernetes.io/pvc-protection]
    Capacity:      3Gi
    Access Modes:  RWO
    VolumeMode:    Filesystem
    Mounted By:    <none>
    Events:        <none>
    $ kubectl get pv my-volume
    
    NAME       CAPACITY   ACCESS MODES   RECLAIM POLICY  STATUS     CLAIM        ⠀⠀⠀STORAGECLASS    REASON     AGE 
    my-volume    3Gi       RWO              Retain       Bound   default/my-claim                          ⠀⠀⠀ 11m
    $ kubectl delete pvc my-claim
    
    persistentvolumeclaim "my-claim" deleted
    $ kubectl get pvc my-claim
    
    No resources found in default namespace.
    $ kubectl get pv my-volume
    
    NAME       CAPACITY   ACCESS MODES   RECLAIM POLICY  STATUS       CLAIM        ⠀⠀⠀STORAGECLASS    REASON     AGE 
    my-volume    3Gi       RWO              Retain       Released   default/my-claim                          ⠀⠀ 21m
    apiVersion: v1
    kind: Pod
    metadata:
      name: my-pod
    spec:
      containers:
      - name: stclass-test
        image: nginx
        volumeMounts:
        - mountPath: "/app/data"
          name: my-volume
      volumes:
      - name: my-volume
        persistentVolumeClaim:
          claimName: my-claim 
    $ vim pvc-pod.yaml
    $ kubectl create -f pvc-pod.yaml
    
    pod/my-pod created
    $ kubectl get pod my-pod
    
    NAME      READY   STATUS    RESTARTS    AGE
    my-pod     1/1    Running      0       6m50s
    $ kubectl describe pod my-pod
    
    Name:         my-pod
    Namespace:    default
    Priority:     0
    Node:         node01/172.17.0.57
    Start Time:   Tue, 01 Dec 2020 11:44:08 +0000
    Labels:       <none>
    Annotations:  <none>
    Status:       Running
    IP:           10.244.1.2
    IPs:
      IP:  10.244.1.2
    Volumes:
      my-volume:
        Type:       PersistentVolumeClaim (a reference to a PersistentVolumeClaim in the same namespace)
        ClaimName:  my-claim
        ReadOnly:   false
      default-token-nlmxj:
        Type:       Secret (a volume populated by a Secret)
        SecretName: default-token-nlmxj
        Optional:   false
    QoS Class:      BestEffort
    $ kubectl exec -it my-pod -- bin/bash
    
    root@my-pod:/# 
    root@my-pod:/# df -h /app/data
    
    Filesystem                   		Size  	 Used 	    Avail       Use% Mountedon 
    /dev/mapper/host01--vg-root  	        191G      22G        159G        13% /app/data
    root@my-pod:/# cd /app/data
    root@my-pod:/app/data# echo "I love Kubermatic" > file.txt
    root@my-pod:/app/data# ls
    file.txt
    root@my-pod:/app/data# cat file.txt
    "I love Kubermatic"
    root@my-pod:/app/data# exit
    $ kubectl delete pod my-pod
    pod "my-pod" deleted
    $ kubectl get pods
    
    No resources found in default namespace.
    $ kubectl create -f pvc-pod.yaml
    pod/my-pod created
    
    $ kubectl get pod my-pod
    
    NAME     READY     STATUS    RESTARTS   AGE
    my-pod    1/1      Running     0         5s
    $ kubectl exec -it my-pod -- bin/bash
    root@my-pod:/# df -h /app/data
    
    Filesystem                     Size    Used    Avail    Use%   Mountedon 
    /dev/mapper/host01--vg-root    191G     22G    159G     13%    /app/data
    
    root@my-pod:/# cd /app/data
    root@my-pod:/app/data# ls
    file.txt
    root@my-pod:/app/data# cat file.txt
    "I love Kubermatic"

    A PV is similar to a node in terms of cluster resources, while a PVC is like a Pod in the context of cluster resource consumption.

    A separate manifest YAML file is needed to create a PV, but not required for a volume.

    Dynamic: The dynamic way of storage provisioning involves creating PVs automatically, using StorageClass instead of manual provisioning of PersistentVolumes. Kubernetes will dynamically provision a volume specifically for this storage request, with the help of a StorageClass. (More about StorageClass and how it is used to provision PVs dynamically in the next part of this series).
    Recycle: This type of reclaim policy will scrub the data in the PV and make it available for another claim.
    PVs and PVCs architecture

    Amazon RDS for PostgreSQL

    PostgreSQL has become the preferred open source relational database for many enterprise developers and start-ups, powering leading business and mobile applications. Amazon RDS makes it easy to set up, operate, and scale PostgreSQL deployments in the cloud. With Amazon RDS, you can deploy scalable PostgreSQL deployments in minutes with cost-efficient and resizable hardware capacity. Amazon RDS manages complex and time-consuming administrative tasks such as PostgreSQL software installation and upgrades; storage management; replication for high availability and read throughput; and backups for disaster recovery.

    Amazon RDS for PostgreSQL gives you access to the capabilities of the familiar PostgreSQL database engine. This means that the code, applications, and tools you already use today with your existing databases can be used with Amazon RDS. Amazon RDS for PostgreSQL currently supports PostgreSQL 9.6, 10, 11, 12, 13, 14 and 15.

    hashtag
    Benefits

    hashtag
    Easy, managed deployments

    It takes only a few clicks in the Amazon Web Services Management Console to launch and connect to a production-ready PostgreSQL database in minutes. Amazon RDS for PostgreSQL database instances are pre-configured with parameters and settings for the server type you have selected. Database parameter groups provide granular control and fine-tuning of your PostgreSQL database.

    hashtag
    Fast, predictable storage

    Amazon RDS provides two SSD-backed storage options for your PostgreSQL database. General Purpose storage provides cost-effective storage for small or medium-sized workloads. For high-performance OLTP applications, Provisioned IOPS delivers consistent performance of up to 80,000 IOs per second. As your storage requirements grow you can provision additional storage on-the-fly with zero downtime.

    hashtag
    Backup and recovery

    The automated backup feature of Amazon RDS enables recovery of your PostgreSQL database instance to any point in time within your specified retention period of up to thirty five days. In addition, you can perform user-initiated backups of your DB Instance. These full database backups will be stored by Amazon RDS until you explicitly delete them.

    hashtag
    High availability and read replicas

    Amazon RDS Multi-AZ deployments provide enhanced availability and durability for your PostgreSQL databases, making them a natural fit for production database workloads. Amazon RDS Read Replicas make it easy to elastically scale out beyond the capacity constraints of a single database instance for read-heavy database workloads.

    hashtag
    Monitoring and metrics

    Amazon RDS for PostgreSQL provides metrics for your database instances at no additional charge and Amazon RDS Enhanced Monitoring provides access to over 50 CPU, memory, file system, and disk I/O metrics. View key operational metrics in Amazon Web Services Management Console, including compute/memory/storage capacity utilization, I/O activity, and instance connections.

    hashtag
    Isolation and security

    As a managed service, Amazon RDS provides a high level of security for your PostgreSQL databases. These include network isolation using , encryption at rest using keys you create and control through and encryption of data in transit using SSL.

    Amazon CloudWatcharrow-up-right
    Amazon Virtual Private Cloud (VPC)arrow-up-right
    Amazon Key Management Service (KMS)arrow-up-right

    AWS

    AWS tutorial provides basic and advanced concepts. Our AWS tutorial is designed for beginners and professionals.

    AWS stands for Amazon Web Services which uses distributed IT infrastructure to provide different IT resources on demand.

    Our AWS tutorial includes all the topics such as introduction, history of aws, global infrastructure, features of aws, IAM, Storage services, Database services, etc.

    hashtag
    What is AWS?

    • AWS stands for Amazon Web Services.

    • The AWS service is provided by the Amazon that uses distributed IT infrastructure to provide different IT resources available on demand. It provides different services such as infrastructure as a service (IaaS), platform as a service (PaaS) and packaged software as a service (SaaS).

    • Amazon launched AWS, a cloud computing platform to allow the different organizations to take advantage of reliable IT infrastructure.

    hashtag
    Uses of AWS

    • A small manufacturing organization uses their expertise to expand their business by leaving their IT management to the AWS.

    • A large enterprise spread across the globe can utilize the AWS to deliver the training to the distributed workforce.

    • An architecture consulting company can use AWS to get the high-compute rendering of construction prototype.

    hashtag
    Pay-As-You-Go

    Based on the concept of Pay-As-You-Go, AWS provides the services to the customers.

    Backward Skip 10sPlay VideoForward Skip 10s

    hashtag
    Advantages of AWS

    hashtag
    1) Flexibility

    • We can get more time for core business tasks due to the instant availability of new features and services in AWS.

    • It provides effortless hosting of legacy applications. AWS does not require learning new technologies and migration of applications to the AWS provides the advanced computing and efficient storage.

    • AWS also offers a choice that whether we want to run the applications and services together or not. We can also choose to run a part of the IT infrastructure in AWS and the remaining part in data centres.

    hashtag
    2) Cost-effectiveness

    AWS requires no upfront investment, long-term commitment, and minimum expense when compared to traditional IT infrastructure that requires a huge investment.

    hashtag
    3) Scalability/Elasticity

    Through AWS, autoscaling and elastic load balancing techniques are automatically scaled up or down, when demand increases or decreases respectively. AWS techniques are ideal for handling unpredictable or very high loads. Due to this reason, organizations enjoy the benefits of reduced cost and increased user satisfaction.

    hashtag
    4) Security

    • AWS provides end-to-end security and privacy to customers.

    • AWS has a virtual infrastructure that offers optimum availability while managing full privacy and isolation of their operations.

    • Customers can expect high-level of physical security because of Amazon's several years of experience in designing, developing and maintaining large-scale IT operation centers.

    hashtag
    History of AWS

    • 2003: In 2003, Chris Pinkham and Benjamin Black presented a paper on how Amazon's own internal infrastructure should look like. They suggested to sell it as a service and prepared a business case on it. They prepared a six-page document and had a look over it to proceed with it or not. They decided to proceed with the documentation.

    • 2004: SQS stands for "Simple Queue Service" was officially launched in 2004. A team launched this service in Cape Town, South Africa.

    • 2006: AWS (Amazon Web Services) was officially launched.

    A media company can use the AWS to provide different types of content such as ebox or audio files to the worldwide files.

    AWS ensures the three aspects of security, i.e., Confidentiality, integrity, and availability of user's data.

  • 2007: In 2007, over 180,000 developers had signed up for the AWS.

  • 2010: In 2010, amazon.com retail web services were moved to the AWS, i.e., amazon.com is now running on AWS.

  • 2011: AWS suffered from some major problems. Some parts of volume of EBS (Elastic Block Store) was stuck and were unable to read and write requests. It took two days for the problem to get resolved.

  • 2012: AWS hosted a first customer event known as re:Invent conference. First re:invent conference occurred in which new products were launched. In AWS, another major problem occurred that affects many popular sites such as Pinterest, Reddit, and Foursquare.

  • 2013: In 2013, certifications were launched. AWS started a certifications program for software engineers who had expertise in cloud computing.

  • 2014: AWS committed to achieve 100% renewable energy usage for its global footprint.

  • 2015: AWS breaks its revenue and reaches to $6 Billion USD per annum. The revenue was growing 90% every year.

  • 2016: By 2016, revenue doubled and reached $13Billion USD per annum.

  • 2017: In 2017, AWS re: invent releases a host of Artificial Intelligence Services due to which revenue of AWS doubled and reached $27 Billion USD per annum.

  • 2018: In 2018, AWS launched a Machine Learning Speciality Certs. It heavily focussed on automating Artificial Intelligence and Machine learning.

  • SeMA Deployment Architecture

    hashtag
    SeMA Logical deployment architecture

    Odoo follows a multi-tier architecture, and we can identify three main tiers: Data, Logic, and Presentation:

    Odoo logical Architecture

    The Data tier is the lowest-level layer, and is responsible for data storage and persistence. Odoo relies on a PostgreSQL server for this. PostgreSQL is the only supported RDBMS, and this is a design choice. So, other databases such as MySQL are not supported. Binary files, such as attachments of documents or images, are usually stored in a filesystem.

    The Logic tier is responsible for all the interactions with the data layer, and is handled by the Odoo server. As a general rule, the low-level database should only be accessed by this layer, since it is the only way to ensure security access control and data consistency. At the core of the Odoo server, we have the Object-Relational Mapping (ORM) engine for this interface. The ORM provides the application programming interface (API) used by the addon modules to interact with the data.

    The Presentation tier is responsible for presenting data and interacting with the user. It is implemented by a client responsible for all the user experience. The client interacts with the ORM API to read, write, verify, or perform any other action, calling ORM API methods through remote procedure calls (RPCs). These are sent to the Odoo server for processing, and then the results are sent back to the client for further handling.

    Ingress Controller: NGINX is web serving, reverse proxying, caching, load balancing, media streaming, and more. It started out as a web server designed for maximum performance and stability. In addition to its HTTP server capabilities, NGINX can also function as a proxy server for email (IMAP, POP3, and SMTP) and a reverse proxy and load balancer for HTTP, TCP, and UDP servers Redis Server: Redis , is a fast, open source, in-memory, key-value data store , All Redis data resides in memory, which enables low latency and high throughput data access. Unlike traditional databases, In-memory data stores don’t require a trip to disk, reducing engine latency to microseconds. Because of this, in-memory data stores can support an order of magnitude more operations and faster response times. The result is blazing-fast performance with average read and write operations taking less than a millisecond and support for millions of operations per second. BI Tool [ MetaBase - SuperSet ]: Business intelligence (BI) tools are types of application software which collect and process large amounts of unstructured data from internal and external systems, including books, journals, documents, health records, images, files, email, video and other business sources

    hashtag
    SeMA physical Deployment Architecture

    Sizing for performance and load requirements is an iterative process that estimates the number of CPUs and corresponding memory required to support the services in the deployed system. When estimating the number of CPUs required to support a service, consider the following:

    • Use cases and corresponding usage analysis that apply to the service

    • System requirements determined during analysis for technical requirements

    • Past experience with the Odoo System components providing the service

    The process of sizing for performance typically consists of the following steps. The ordering of these steps is not critical—it simply provides a way to consider the factors that affect the final result.

    1. Determine a baseline CPU estimate for components identified as user entry points to the system.

    2. Make adjustments to the CPU estimates to account for dependencies between components.

    3. Make adjustments to the CPU estimates to reflect security, availability, scalability, and latent capacity requirements.

    SeMA Deployment Logical Architecture
    SeMA Deployment Architecture

    Offline Production Deployment

    Linux for DevOps

    hashtag
    Linux History

    Evolution of Computer In earlier days, computers were as big as houses or parks. So you can imagine how difficult it was to operate them. Moreover, every computer has a different operating system which made it completely worse to operate on them. Every software was designed for a specific purpose and was unable to operate on other computer. It was extremely costly and normal people neither can afford it nor can understand it.

    Evolution of Unix In 1969, a team of developers of Bell Labs started a project to make a common software for all the computers and named it as 'Unix'. It was simple and elegant, used 'C' language instead of assembly language and its code was recyclable. As it was recyclable, a part of its code now commonly called 'kernel' was used to develop the operating system and other functions and could be used on different systems. Also its source code was open source.

    Initially, Unix was only found in large organizations like government, university, or larger financial corporations with mainframes and minicomputers (PC is a microcomputer).

    hashtag
    Linux Licensing

    Linus Torvalds has given linux kernel license to GNU General Public License (GPL) version 2. GNU make sure that any software source code licensed under it have to make originating source code open and freely availble to all its users. Here, freely doesn't mean by cost but it means that it is freely available to users to distribute and modify the code.

    hashtag
    Linux Features

    • Portable: Linux OS can perform different types of hardware and the kernel of Linux supports the installation of any type of hardware environment.

    • Open source: Linux operating system source code is available freely and for enhancing the capability of the Linux OS, several teams are performing in collaboration.

    • Multiprogramming: Linux OS can be defined as a multiprogramming system. It means more than one application can be executed at the same time.

    Why Use Linux Linux ?

    is completely different from other operating systems in many ways.It is an open source OS which gives a great advantage to the programmers as they can design their own custom operating systems. It gives you a lot of option of programs having some different features so you can choose according to your need. A global development community look at different ways to enhance its security, hence it is highly secured and robust so you don't need an anti virus to scan it regularly. Companies like Google, Amazon and Facebook use linux in order to protect their servers as it is highly reliable and stable. Above all you don't have to pay for software and server licensing to install Linux, its absolutely free and you can install it on as many computers as you want. Its completely trouble free operating system and don't have an issue with viruses, malware and slowing down your computer.

    hashtag
    Linux Distributions

    Multi-user: Linux OS can also be defined as a multi-user system. It means more than one user can use the resources of the system such as application programs, memory, or RAM at the same time.

  • Hierarchical file system: Linux OS affords a typical file structure where user files or system files are arranged.

  • Security: Linux OS facilitates user security systems with the help of various features of authentication such as controlled access to specific files, password protection, or data encryption.

  • Shell: Linux operating system facilitates a unique interpreter program. This type of program can be applied for executing commands of the operating system. It can be applied to perform various types of tasks such as call application programs and othe

  • DevOps part 1 : interview

    hashtag
    DevOps Terminology

    hashtag
    Linux

    hashtag

    hashtag
    GIT

    hashtag
    Docker

    hashtag
    Live code screening

    circle-check
    circle-info

    circle-info

    References

    1-

    2-

    3-

    Check User Information
  • Git Branching Model ?
  • Docker network
  • https://www.edureka.co/blog/interview-questions/top-devops-interview-questions-2016/arrow-up-right
    https://www.simplilearn.com/tutorials/devops-tutorial/devops-interview-questionsarrow-up-right
    https://www.guru99.com/devops-interview-questions.htmlarrow-up-right
     Lab1 :
            - script to detect OS  
            - install git
            - clone public project from github
            - backup project dir with date 
            - cron job for back dir
     Lab2 :
           - Build Docker file for Spring or Angular  or laravel
           - Build Docker compose for  Spring or Angular  or laravel
     Advanced Lab : 
     
           - build docker-compose project with Microservice with git submodule

    Kubernetes Session 3

    Deploymentsarrow-up-right

    ReplicaSetarrow-up-right

    StatefulSetsarrow-up-right

    DaemonSetarrow-up-right

    Jobsarrow-up-right

    Automatic Cleanup for Finished Jobsarrow-up-right

    A time-to-live mechanism to clean up old Jobs that have finished execution.

    hashtag
    ReplicaSet

    A ReplicaSet's purpose is to maintain a stable set of replica Pods running at any given time. As such, it is often used to guarantee the availability of a specified number of identical Pods.

    hashtag
    How a ReplicaSet works

    A ReplicaSet is defined with fields, including a selector that specifies how to identify Pods it can acquire, a number of replicas indicating how many Pods it should be maintaining, and a pod template specifying the data of new Pods it should create to meet the number of replicas criteria. A ReplicaSet then fulfills its purpose by creating and deleting Pods as needed to reach the desired number. When a ReplicaSet needs to create new Pods, it uses its Pod template.

    A ReplicaSet is linked to its Pods via the Pods' field, which specifies what resource the current object is owned by. All Pods acquired by a ReplicaSet have their owning ReplicaSet's identifying information within their ownerReferences field. It's through this link that the ReplicaSet knows of the state of the Pods it is maintaining and plans accordingly.

    A ReplicaSet identifies new Pods to acquire by using its selector. If there is a Pod that has no OwnerReference or the OwnerReference is not a and it matches a ReplicaSet's selector, it will be immediately acquired by said ReplicaSet.

    hashtag
    When to use a ReplicaSet

    A ReplicaSet ensures that a specified number of pod replicas are running at any given time. However, a Deployment is a higher-level concept that manages ReplicaSets and provides declarative updates to Pods along with a lot of other useful features. Therefore, we recommend using Deployments instead of directly using ReplicaSets, unless you require custom update orchestration or don't require updates at all.

    This actually means that you may never need to manipulate ReplicaSet objects: use a Deployment instead, and define your application in the spec section.

    hashtag
    Example

    Saving this manifest into frontend.yaml and submitting it to a Kubernetes cluster will create the defined ReplicaSet and the Pods that it manages.

    You can then get the current ReplicaSets deployed:

    And see the frontend one you created:

    You can also check on the state of the ReplicaSet:

    And you will see output similar to:

    And lastly you can check for the Pods brought up:

    You should see Pod information similar to:

    You can also verify that the owner reference of these pods is set to the frontend ReplicaSet. To do this, get the yaml of one of the Pods running:

    The output will look similar to this, with the frontend ReplicaSet's info set in the metadata's ownerReferences field:

    hashtag
    Non-Template Pod acquisitions

    While you can create bare Pods with no problems, it is strongly recommended to make sure that the bare Pods do not have labels which match the selector of one of your ReplicaSets. The reason for this is because a ReplicaSet is not limited to owning Pods specified by its template-- it can acquire other Pods in the manner specified in the previous sections.

    Take the previous frontend ReplicaSet example, and the Pods specified in the following manifest:

    As those Pods do not have a Controller (or any object) as their owner reference and match the selector of the frontend ReplicaSet, they will immediately be acquired by it.

    Suppose you create the Pods after the frontend ReplicaSet has been deployed and has set up its initial Pod replicas to fulfill its replica count requirement:

    The new Pods will be acquired by the ReplicaSet, and then immediately terminated as the ReplicaSet would be over its desired count.

    Fetching the Pods:

    The output shows that the new Pods are either already terminated, or in the process of being terminated:

    If you create the Pods first:

    And then create the ReplicaSet however:

    You shall see that the ReplicaSet has acquired the Pods and has only created new ones according to its spec until the number of its new Pods and the original matches its desired count. As fetching the Pods:

    Will reveal in its output:

    In this manner, a ReplicaSet can own a non-homogenous set of Pods

    hashtag
    Writing a ReplicaSet manifest

    As with all other Kubernetes API objects, a ReplicaSet needs the apiVersion, kind, and metadata fields. For ReplicaSets, the kind is always a ReplicaSet.

    When the control plane creates new Pods for a ReplicaSet, the .metadata.name of the ReplicaSet is part of the basis for naming those Pods. The name of a ReplicaSet must be a valid value, but this can produce unexpected results for the Pod hostnames. For best compatibility, the name should follow the more restrictive rules for a .

    A ReplicaSet also needs a .

    hashtag
    Pod Template

    The .spec.template is a which is also required to have labels in place. In our frontend.yaml example we had one label: tier: frontend. Be careful not to overlap with the selectors of other controllers, lest they try to adopt this Pod.

    For the template's field, .spec.template.spec.restartPolicy, the only allowed value is Always, which is the default.

    hashtag
    Pod Selector

    The .spec.selector field is a . As discussed these are the labels used to identify potential Pods to acquire. In our frontend.yaml example, the selector was:

    In the ReplicaSet, .spec.template.metadata.labels must match spec.selector, or it will be rejected by the API.

    Note: For 2 ReplicaSets specifying the same .spec.selector but different .spec.template.metadata.labels and .spec.template.spec fields, each ReplicaSet ignores the Pods created by the other ReplicaSet.

    hashtag
    Replicas

    You can specify how many Pods should run concurrently by setting .spec.replicas. The ReplicaSet will create/delete its Pods to match this number.

    If you do not specify .spec.replicas, then it defaults to 1.

    hashtag
    Working with ReplicaSets

    hashtag
    Deleting a ReplicaSet and its Pods

    To delete a ReplicaSet and all of its Pods, use . The automatically deletes all of the dependent Pods by default.

    When using the REST API or the client-go library, you must set propagationPolicy to Background or Foreground in the -d option. For example:

    hashtag
    Deleting just a ReplicaSet

    You can delete a ReplicaSet without affecting any of its Pods using with the --cascade=orphan option. When using the REST API or the client-go library, you must set propagationPolicy to Orphan. For example:

    Once the original is deleted, you can create a new ReplicaSet to replace it. As long as the old and new .spec.selector are the same, then the new one will adopt the old Pods. However, it will not make any effort to make existing Pods match a new, different pod template. To update Pods to a new spec in a controlled way, use a , as ReplicaSets do not support a rolling update directly.

    hashtag
    Isolating Pods from a ReplicaSet

    You can remove Pods from a ReplicaSet by changing their labels. This technique may be used to remove Pods from service for debugging, data recovery, etc. Pods that are removed in this way will be replaced automatically ( assuming that the number of replicas is not also changed).

    hashtag
    Scaling a ReplicaSet

    A ReplicaSet can be easily scaled up or down by simply updating the .spec.replicas field. The ReplicaSet controller ensures that a desired number of Pods with a matching label selector are available and operational.

    When scaling down, the ReplicaSet controller chooses which pods to delete by sorting the available pods to prioritize scaling down pods based on the following general algorithm:

    1. Pending (and unschedulable) pods are scaled down first

    2. If controller.kubernetes.io/pod-deletion-cost annotation is set, then the pod with the lower value will come first.

    3. Pods on nodes with more replicas come before pods on nodes with fewer replicas.

    If all of the above match, then selection is random.

    hashtag
    Pod deletion cost

    FEATURE STATE: Kubernetes v1.22 [beta]

    Using the annotation, users can set a preference regarding which pods to remove first when downscaling a ReplicaSet.

    The annotation should be set on the pod, the range is [-2147483647, 2147483647]. It represents the cost of deleting a pod compared to other pods belonging to the same ReplicaSet. Pods with lower deletion cost are preferred to be deleted before pods with higher deletion cost.

    The implicit value for this annotation for pods that don't set it is 0; negative values are permitted. Invalid values will be rejected by the API server.

    This feature is beta and enabled by default. You can disable it using the PodDeletionCost in both kube-apiserver and kube-controller-manager.

    Note:

    • This is honored on a best-effort basis, so it does not offer any guarantees on pod deletion order.

    • Users should avoid updating the annotation frequently, such as updating it based on a metric value, because doing so will generate a significant number of pod updates on the apiserver.

    Example Use Case

    The different pods of an application could have different utilization levels. On scale down, the application may prefer to remove the pods with lower utilization. To avoid frequently updating the pods, the application should update controller.kubernetes.io/pod-deletion-cost once before issuing a scale down (setting the annotation to a value proportional to pod utilization level). This works if the application itself controls the down scaling; for example, the driver pod of a Spark deployment.

    hashtag
    ReplicaSet as a Horizontal Pod Autoscaler Target

    A ReplicaSet can also be a target for . That is, a ReplicaSet can be auto-scaled by an HPA. Here is an example HPA targeting the ReplicaSet we created in the previous example.

    Saving this manifest into hpa-rs.yaml and submitting it to a Kubernetes cluster should create the defined HPA that autoscales the target ReplicaSet depending on the CPU usage of the replicated Pods.

    Alternatively, you can use the kubectl autoscale command to accomplish the same (and it's easier!)

    hashtag
    ReplicationController

    Note: A that configures a is now the recommended way to set up replication.

    A ReplicationController ensures that a specified number of pod replicas are running at any one time. In other words, a ReplicationController makes sure that a pod or a homogeneous set of pods is always up and available.

    hashtag
    How a ReplicationController Works

    If there are too many pods, the ReplicationController terminates the extra pods. If there are too few, the ReplicationController starts more pods. Unlike manually created pods, the pods maintained by a ReplicationController are automatically replaced if they fail, are deleted, or are terminated. For example, your pods are re-created on a node after disruptive maintenance such as a kernel upgrade. For this reason, you should use a ReplicationController even if your application requires only a single pod. A ReplicationController is similar to a process supervisor, but instead of supervising individual processes on a single node, the ReplicationController supervises multiple pods across multiple nodes.

    ReplicationController is often abbreviated to "rc" in discussion, and as a shortcut in kubectl commands.

    A simple case is to create one ReplicationController object to reliably run one instance of a Pod indefinitely. A more complex use case is to run several identical replicas of a replicated service, such as web servers.

    hashtag
    Running an example ReplicationController

    This example ReplicationController config runs three copies of the nginx web server.

    Run the example job by downloading the example file and then running this command:

    The output is similar to this:

    Check on the status of the ReplicationController using this command:

    The output is similar to this:

    Here, three pods are created, but none is running yet, perhaps because the image is being pulled. A little later, the same command may show:

    To list all the pods that belong to the ReplicationController in a machine readable form, you can use a command like this:

    The output is similar to this:

    Here, the selector is the same as the selector for the ReplicationController (seen in the kubectl describe output), and in a different form in replication.yaml. The --output=jsonpath option specifies an expression with the name from each pod in the returned list.

    hashtag
    Writing a ReplicationController Manifest

    As with all other Kubernetes config, a ReplicationController needs apiVersion, kind, and metadata fields.

    When the control plane creates new Pods for a ReplicationController, the .metadata.name of the ReplicationController is part of the basis for naming those Pods. The name of a ReplicationController must be a valid value, but this can produce unexpected results for the Pod hostnames. For best compatibility, the name should follow the more restrictive rules for a .

    For general information about working with configuration files, see .

    A ReplicationController also needs a .

    hashtag
    Pod Template

    The .spec.template is the only required field of the .spec.

    The .spec.template is a . It has exactly the same schema as a , except it is nested and does not have an apiVersion or kind.

    In addition to required fields for a Pod, a pod template in a ReplicationController must specify appropriate labels and an appropriate restart policy. For labels, make sure not to overlap with other controllers. See .

    Only a equal to Always is allowed, which is the default if not specified.

    For local container restarts, ReplicationControllers delegate to an agent on the node, for example the .

    hashtag
    Labels on the ReplicationController

    The ReplicationController can itself have labels (.metadata.labels). Typically, you would set these the same as the .spec.template.metadata.labels; if .metadata.labels is not specified then it defaults to .spec.template.metadata.labels. However, they are allowed to be different, and the .metadata.labels do not affect the behavior of the ReplicationController.

    hashtag
    Pod Selector

    The .spec.selector field is a . A ReplicationController manages all the pods with labels that match the selector. It does not distinguish between pods that it created or deleted and pods that another person or process created or deleted. This allows the ReplicationController to be replaced without affecting the running pods.

    If specified, the .spec.template.metadata.labels must be equal to the .spec.selector, or it will be rejected by the API. If .spec.selector is unspecified, it will be defaulted to .spec.template.metadata.labels.

    Also you should not normally create any pods whose labels match this selector, either directly, with another ReplicationController, or with another controller such as Job. If you do so, the ReplicationController thinks that it created the other pods. Kubernetes does not stop you from doing this.

    If you do end up with multiple controllers that have overlapping selectors, you will have to manage the deletion yourself (see ).

    hashtag
    Multiple Replicas

    You can specify how many pods should run concurrently by setting .spec.replicas to the number of pods you would like to have running concurrently. The number running at any time may be higher or lower, such as if the replicas were just increased or decreased, or if a pod is gracefully shutdown, and a replacement starts early.

    If you do not specify .spec.replicas, then it defaults to 1.

    hashtag
    Working with ReplicationControllers

    hashtag
    Deleting a ReplicationController and its Pods

    To delete a ReplicationController and all its pods, use . Kubectl will scale the ReplicationController to zero and wait for it to delete each pod before deleting the ReplicationController itself. If this kubectl command is interrupted, it can be restarted.

    When using the REST API or , you need to do the steps explicitly (scale replicas to 0, wait for pod deletions, then delete the ReplicationController).

    hashtag
    Deleting only a ReplicationController

    You can delete a ReplicationController without affecting any of its pods.

    Using kubectl, specify the --cascade=orphan option to .

    When using the REST API or , you can delete the ReplicationController object.

    Once the original is deleted, you can create a new ReplicationController to replace it. As long as the old and new .spec.selector are the same, then the new one will adopt the old pods. However, it will not make any effort to make existing pods match a new, different pod template. To update pods to a new spec in a controlled way, use a .

    hashtag
    Isolating pods from a ReplicationController

    Pods may be removed from a ReplicationController's target set by changing their labels. This technique may be used to remove pods from service for debugging and data recovery. Pods that are removed in this way will be replaced automatically (assuming that the number of replicas is not also changed).

    hashtag
    Common usage patterns

    hashtag
    Rescheduling

    As mentioned above, whether you have 1 pod you want to keep running, or 1000, a ReplicationController will ensure that the specified number of pods exists, even in the event of node failure or pod termination (for example, due to an action by another control agent).

    hashtag
    Scaling

    The ReplicationController enables scaling the number of replicas up or down, either manually or by an auto-scaling control agent, by updating the replicas field.

    hashtag
    Rolling updates

    The ReplicationController is designed to facilitate rolling updates to a service by replacing pods one-by-one.

    As explained in , the recommended approach is to create a new ReplicationController with 1 replica, scale the new (+1) and old (-1) controllers one by one, and then delete the old controller after it reaches 0 replicas. This predictably updates the set of pods regardless of unexpected failures.

    Ideally, the rolling update controller would take application readiness into account, and would ensure that a sufficient number of pods were productively serving at any given time.

    The two ReplicationControllers would need to create pods with at least one differentiating label, such as the image tag of the primary container of the pod, since it is typically image updates that motivate rolling updates.

    hashtag
    Multiple release tracks

    In addition to running multiple releases of an application while a rolling update is in progress, it's common to run multiple releases for an extended period of time, or even continuously, using multiple release tracks. The tracks would be differentiated by labels.

    For instance, a service might target all pods with tier in (frontend), environment in (prod). Now say you have 10 replicated pods that make up this tier. But you want to be able to 'canary' a new version of this component. You could set up a ReplicationController with replicas set to 9 for the bulk of the replicas, with labels tier=frontend, environment=prod, track=stable, and another ReplicationController with replicas set to 1 for the canary, with labels tier=frontend, environment=prod, track=canary. Now the service is covering both the canary and non-canary pods. But you can mess with the ReplicationControllers separately to test things out, monitor the results, etc.

    hashtag
    Using ReplicationControllers with Services

    Multiple ReplicationControllers can sit behind a single service, so that, for example, some traffic goes to the old version, and some goes to the new version.

    A ReplicationController will never terminate on its own, but it isn't expected to be as long-lived as services. Services may be composed of pods controlled by multiple ReplicationControllers, and it is expected that many ReplicationControllers may be created and destroyed over the lifetime of a service (for instance, to perform an update of pods that run the service). Both services themselves and their clients should remain oblivious to the ReplicationControllers that maintain the pods of the services.

    hashtag
    Writing programs for Replication

    Pods created by a ReplicationController are intended to be fungible and semantically identical, though their configurations may become heterogeneous over time. This is an obvious fit for replicated stateless servers, but ReplicationControllers can also be used to maintain availability of master-elected, sharded, and worker-pool applications. Such applications should use dynamic work assignment mechanisms, such as the , as opposed to static/one-time customization of the configuration of each pod, which is considered an anti-pattern. Any pod customization performed, such as vertical auto-sizing of resources (for example, cpu or memory), should be performed by another online controller process, not unlike the ReplicationController itself.

    hashtag
    Responsibilities of the ReplicationController

    The ReplicationController ensures that the desired number of pods matches its label selector and are operational. Currently, only terminated pods are excluded from its count. In the future, and other information available from the system may be taken into account, we may add more controls over the replacement policy, and we plan to emit events that could be used by external clients to implement arbitrarily sophisticated replacement and/or scale-down policies.

    The ReplicationController is forever constrained to this narrow responsibility. It itself will not perform readiness nor liveness probes. Rather than performing auto-scaling, it is intended to be controlled by an external auto-scaler (as discussed in ), which would change its replicas field. We will not add scheduling policies (for example, ) to the ReplicationController. Nor should it verify that the pods controlled match the currently specified template, as that would obstruct auto-sizing and other automated processes. Similarly, completion deadlines, ordering dependencies, configuration expansion, and other features belong elsewhere. We even plan to factor out the mechanism for bulk pod creation ().

    The ReplicationController is intended to be a composable building-block primitive. We expect higher-level APIs and/or tools to be built on top of it and other complementary primitives for user convenience in the future. The "macro" operations currently supported by kubectl (run, scale) are proof-of-concept examples of this. For instance, we could imagine something like managing ReplicationControllers, auto-scalers, services, scheduling policies, canaries, etc.

    hashtag
    Deployments

    A Deployment provides declarative updates for and .

    You describe a desired state in a Deployment, and the Deployment changes the actual state to the desired state at a controlled rate. You can define Deployments to create new ReplicaSets, or to remove existing Deployments and adopt all their resources with new Deployments.

    Note: Do not manage ReplicaSets owned by a Deployment. Consider opening an issue in the main Kubernetes repository if your use case is not covered below.

    hashtag
    Use Case

    The following are typical use cases for Deployments:

    • . The ReplicaSet creates Pods in the background. Check the status of the rollout to see if it succeeds or not.

    • by updating the PodTemplateSpec of the Deployment. A new ReplicaSet is created and the Deployment manages moving the Pods from the old ReplicaSet to the new one at a controlled rate. Each new ReplicaSet updates the revision of the Deployment.

    • if the current state of the Deployment is not stable. Each rollback updates the revision of the Deployment.

    hashtag
    Creating a Deployment

    Before creating a Deployment define an for a container.

    The following is an example of a Deployment. It creates a ReplicaSet to bring up three nginx Pods:

    In this example:

    • A Deployment named nginx-deployment is created, indicated by the .metadata.name field. This name will become the basis for the ReplicaSets and Pods which are created later. See for more details.

    • The Deployment creates a ReplicaSet that creates three replicated Pods, indicated by the .spec.replicas field.

    Before you begin, make sure your Kubernetes cluster is up and running. Follow the steps given below to create the above Deployment:

    1. Create the Deployment by running the following command:

    2. Run kubectl get deployments to check if the Deployment was created.

      If the Deployment is still being created, the output is similar to the following:

      When you inspect the Deployments in your cluster, the following fields are displayed:

    Note:

    You must specify an appropriate selector and Pod template labels in a Deployment (in this case, app: nginx).

    Do not overlap labels or selectors with other controllers (including other Deployments and StatefulSets). Kubernetes doesn't stop you from overlapping, and if multiple controllers have overlapping selectors those controllers might conflict and behave unexpectedly.

    hashtag
    Pod-template-hash label

    Caution: Do not change this label.

    The pod-template-hash label is added by the Deployment controller to every ReplicaSet that a Deployment creates or adopts.

    This label ensures that child ReplicaSets of a Deployment do not overlap. It is generated by hashing the PodTemplate of the ReplicaSet and using the resulting hash as the label value that is added to the ReplicaSet selector, Pod template labels, and in any existing Pods that the ReplicaSet might have.

    hashtag
    Updating a Deployment

    Note: A Deployment's rollout is triggered if and only if the Deployment's Pod template (that is, .spec.template) is changed, for example if the labels or container images of the template are updated. Other updates, such as scaling the Deployment, do not trigger a rollout.

    Follow the steps given below to update your Deployment:

    1. Let's update the nginx Pods to use the nginx:1.16.1 image instead of the nginx:1.14.2 image.

      or use the following command:

      where deployment/nginx-deployment indicates the Deployment, nginx indicates the Container the update will take place and nginx:1.16.1 indicates the new image and its tag.

    Get more details on your updated Deployment:

    • After the rollout succeeds, you can view the Deployment by running kubectl get deployments. The output is similar to this:

    • Run kubectl get rs to see that the Deployment updated the Pods by creating a new ReplicaSet and scaling it up to 3 replicas, as well as scaling down the old ReplicaSet to 0 replicas.

      The output is similar to this:

    Note: Kubernetes doesn't count terminating Pods when calculating the number of availableReplicas, which must be between replicas - maxUnavailable and replicas + maxSurge. As a result, you might notice that there are more Pods than expected during a rollout, and that the total resources consumed by the Deployment is more than replicas + maxSurge until the terminationGracePeriodSeconds of the terminating Pods expires.

    hashtag
    Rollover (aka multiple updates in-flight)

    Each time a new Deployment is observed by the Deployment controller, a ReplicaSet is created to bring up the desired Pods. If the Deployment is updated, the existing ReplicaSet that controls Pods whose labels match .spec.selector but whose template does not match .spec.template are scaled down. Eventually, the new ReplicaSet is scaled to .spec.replicas and all old ReplicaSets is scaled to 0.

    If you update a Deployment while an existing rollout is in progress, the Deployment creates a new ReplicaSet as per the update and start scaling that up, and rolls over the ReplicaSet that it was scaling up previously -- it will add it to its list of old ReplicaSets and start scaling it down.

    For example, suppose you create a Deployment to create 5 replicas of nginx:1.14.2, but then update the Deployment to create 5 replicas of nginx:1.16.1, when only 3 replicas of nginx:1.14.2 had been created. In that case, the Deployment immediately starts killing the 3 nginx:1.14.2 Pods that it had created, and starts creating nginx:1.16.1 Pods. It does not wait for the 5 replicas of nginx:1.14.2 to be created before changing course.

    hashtag
    Label selector updates

    It is generally discouraged to make label selector updates and it is suggested to plan your selectors up front. In any case, if you need to perform a label selector update, exercise great caution and make sure you have grasped all of the implications.

    Note: In API version apps/v1, a Deployment's label selector is immutable after it gets created.

    • Selector additions require the Pod template labels in the Deployment spec to be updated with the new label too, otherwise a validation error is returned. This change is a non-overlapping one, meaning that the new selector does not select ReplicaSets and Pods created with the old selector, resulting in orphaning all old ReplicaSets and creating a new ReplicaSet.

    • Selector updates changes the existing value in a selector key -- result in the same behavior as additions.

    • Selector removals removes an existing key from the Deployment selector -- do not require any changes in the Pod template labels. Existing ReplicaSets are not orphaned, and a new ReplicaSet is not created, but note that the removed label still exists in any existing Pods and ReplicaSets.

    hashtag
    Rolling Back a Deployment

    Sometimes, you may want to rollback a Deployment; for example, when the Deployment is not stable, such as crash looping. By default, all of the Deployment's rollout history is kept in the system so that you can rollback anytime you want (you can change that by modifying revision history limit).

    Note: A Deployment's revision is created when a Deployment's rollout is triggered. This means that the new revision is created if and only if the Deployment's Pod template (.spec.template) is changed, for example if you update the labels or container images of the template. Other updates, such as scaling the Deployment, do not create a Deployment revision, so that you can facilitate simultaneous manual- or auto-scaling. This means that when you roll back to an earlier revision, only the Deployment's Pod template part is rolled back.

    • Suppose that you made a typo while updating the Deployment, by putting the image name as nginx:1.161 instead of nginx:1.16.1:

      The output is similar to this:

    • The rollout gets stuck. You can verify it by checking the rollout status:

      The output is similar to this:

    hashtag
    Checking Rollout History of a Deployment

    Follow the steps given below to check the rollout history:

    1. First, check the revisions of this Deployment:

      The output is similar to this:

      CHANGE-CAUSE is copied from the Deployment annotation kubernetes.io/change-cause to its revisions upon creation. You can specify theCHANGE-CAUSE message by:

    hashtag
    Rolling Back to a Previous Revision

    Follow the steps given below to rollback the Deployment from the current version to the previous version, which is version 2.

    1. Now you've decided to undo the current rollout and rollback to the previous revision:

      The output is similar to this:

      Alternatively, you can rollback to a specific revision by specifying it with --to-revision:

      The output is similar to this:

      For more details about rollout related commands, read .

    hashtag
    Scaling a Deployment

    You can scale a Deployment by using the following command:

    The output is similar to this:

    Assuming is enabled in your cluster, you can set up an autoscaler for your Deployment and choose the minimum and maximum number of Pods you want to run based on the CPU utilization of your existing Pods.

    The output is similar to this:

    hashtag
    Proportional scaling

    RollingUpdate Deployments support running multiple versions of an application at the same time. When you or an autoscaler scales a RollingUpdate Deployment that is in the middle of a rollout (either in progress or paused), the Deployment controller balances the additional replicas in the existing active ReplicaSets (ReplicaSets with Pods) in order to mitigate risk. This is called proportional scaling.

    For example, you are running a Deployment with 10 replicas, =3, and =2.

    • Ensure that the 10 replicas in your Deployment are running.

      The output is similar to this:

    • You update to a new image which happens to be unresolvable from inside the cluster.

      The output is similar to this:

    In our example above, 3 replicas are added to the old ReplicaSet and 2 replicas are added to the new ReplicaSet. The rollout process should eventually move all replicas to the new ReplicaSet, assuming the new replicas become healthy. To confirm this, run:

    The output is similar to this:

    The rollout status confirms how the replicas were added to each ReplicaSet.

    The output is similar to this:

    hashtag
    Pausing and Resuming a rollout of a Deployment

    When you update a Deployment, or plan to, you can pause rollouts for that Deployment before you trigger one or more updates. When you're ready to apply those changes, you resume rollouts for the Deployment. This approach allows you to apply multiple fixes in between pausing and resuming without triggering unnecessary rollouts.

    • For example, with a Deployment that was created:

      Get the Deployment details:

      The output is similar to this:

      Get the rollout status:

      The output is similar to this:

    Note: You cannot rollback a paused Deployment until you resume it.

    hashtag
    Deployment status

    A Deployment enters various states during its lifecycle. It can be while rolling out a new ReplicaSet, it can be , or it can .

    hashtag
    Progressing Deployment

    Kubernetes marks a Deployment as progressing when one of the following tasks is performed:

    • The Deployment creates a new ReplicaSet.

    • The Deployment is scaling up its newest ReplicaSet.

    • The Deployment is scaling down its older ReplicaSet(s).

    When the rollout becomes “progressing”, the Deployment controller adds a condition with the following attributes to the Deployment's .status.conditions:

    • type: Progressing

    • status: "True"

    • reason: NewReplicaSetCreated | reason: FoundNewReplicaSet

    You can monitor the progress for a Deployment by using kubectl rollout status.

    hashtag
    Complete Deployment

    Kubernetes marks a Deployment as complete when it has the following characteristics:

    • All of the replicas associated with the Deployment have been updated to the latest version you've specified, meaning any updates you've requested have been completed.

    • All of the replicas associated with the Deployment are available.

    • No old replicas for the Deployment are running.

    When the rollout becomes “complete”, the Deployment controller sets a condition with the following attributes to the Deployment's .status.conditions:

    • type: Progressing

    • status: "True"

    • reason: NewReplicaSetAvailable

    This Progressing condition will retain a status value of "True" until a new rollout is initiated. The condition holds even when availability of replicas changes (which does instead affect the Available condition).

    You can check if a Deployment has completed by using kubectl rollout status. If the rollout completed successfully, kubectl rollout status returns a zero exit code.

    The output is similar to this:

    and the exit status from kubectl rollout is 0 (success):

    hashtag
    Failed Deployment

    Your Deployment may get stuck trying to deploy its newest ReplicaSet without ever completing. This can occur due to some of the following factors:

    • Insufficient quota

    • Readiness probe failures

    • Image pull errors

    One way you can detect this condition is to specify a deadline parameter in your Deployment spec: (). .spec.progressDeadlineSeconds denotes the number of seconds the Deployment controller waits before indicating (in the Deployment status) that the Deployment progress has stalled.

    The following kubectl command sets the spec with progressDeadlineSeconds to make the controller report lack of progress of a rollout for a Deployment after 10 minutes:

    The output is similar to this:

    Once the deadline has been exceeded, the Deployment controller adds a DeploymentCondition with the following attributes to the Deployment's .status.conditions:

    • type: Progressing

    • status: "False"

    • reason: ProgressDeadlineExceeded

    This condition can also fail early and is then set to status value of "False" due to reasons as ReplicaSetCreateError. Also, the deadline is not taken into account anymore once the Deployment rollout completes.

    See the for more information on status conditions.

    Note: Kubernetes takes no action on a stalled Deployment other than to report a status condition with reason: ProgressDeadlineExceeded. Higher level orchestrators can take advantage of it and act accordingly, for example, rollback the Deployment to its previous version.Note: If you pause a Deployment rollout, Kubernetes does not check progress against your specified deadline. You can safely pause a Deployment rollout in the middle of a rollout and resume without triggering the condition for exceeding the deadline.

    You may experience transient errors with your Deployments, either due to a low timeout that you have set or due to any other kind of error that can be treated as transient. For example, let's suppose you have insufficient quota. If you describe the Deployment you will notice the following section:

    The output is similar to this:

    If you run kubectl get deployment nginx-deployment -o yaml, the Deployment status is similar to this:

    Eventually, once the Deployment progress deadline is exceeded, Kubernetes updates the status and the reason for the Progressing condition:

    You can address an issue of insufficient quota by scaling down your Deployment, by scaling down other controllers you may be running, or by increasing quota in your namespace. If you satisfy the quota conditions and the Deployment controller then completes the Deployment rollout, you'll see the Deployment's status update with a successful condition (status: "True" and reason: NewReplicaSetAvailable).

    type: Available with status: "True" means that your Deployment has minimum availability. Minimum availability is dictated by the parameters specified in the deployment strategy. type: Progressing with status: "True" means that your Deployment is either in the middle of a rollout and it is progressing or that it has successfully completed its progress and the minimum required new replicas are available (see the Reason of the condition for the particulars - in our case reason: NewReplicaSetAvailable means that the Deployment is complete).

    You can check if a Deployment has failed to progress by using kubectl rollout status. kubectl rollout status returns a non-zero exit code if the Deployment has exceeded the progression deadline.

    The output is similar to this:

    and the exit status from kubectl rollout is 1 (indicating an error):

    hashtag
    Operating on a failed deployment

    All actions that apply to a complete Deployment also apply to a failed Deployment. You can scale it up/down, roll back to a previous revision, or even pause it if you need to apply multiple tweaks in the Deployment Pod template.

    hashtag
    Clean up Policy

    You can set .spec.revisionHistoryLimit field in a Deployment to specify how many old ReplicaSets for this Deployment you want to retain. The rest will be garbage-collected in the background. By default, it is 10.

    Note: Explicitly setting this field to 0, will result in cleaning up all the history of your Deployment thus that Deployment will not be able to roll back.

    hashtag
    Canary Deployment

    If you want to roll out releases to a subset of users or servers using the Deployment, you can create multiple Deployments, one for each release, following the canary pattern described in .

    hashtag
    Writing a Deployment Spec

    As with all other Kubernetes configs, a Deployment needs .apiVersion, .kind, and .metadata fields. For general information about working with config files, see , configuring containers, and documents.

    When the control plane creates new Pods for a Deployment, the .metadata.name of the Deployment is part of the basis for naming those Pods. The name of a Deployment must be a valid value, but this can produce unexpected results for the Pod hostnames. For best compatibility, the name should follow the more restrictive rules for a .

    A Deployment also needs a .

    hashtag
    Pod Template

    The .spec.template and .spec.selector are the only required fields of the .spec.

    The .spec.template is a . It has exactly the same schema as a , except it is nested and does not have an apiVersion or kind.

    In addition to required fields for a Pod, a Pod template in a Deployment must specify appropriate labels and an appropriate restart policy. For labels, make sure not to overlap with other controllers. See .

    Only a equal to Always is allowed, which is the default if not specified.

    hashtag
    Replicas

    .spec.replicas is an optional field that specifies the number of desired Pods. It defaults to 1.

    Should you manually scale a Deployment, example via kubectl scale deployment deployment --replicas=X, and then you update that Deployment based on a manifest (for example: by running kubectl apply -f deployment.yaml), then applying that manifest overwrites the manual scaling that you previously did.

    If a (or any similar API for horizontal scaling) is managing scaling for a Deployment, don't set .spec.replicas.

    Instead, allow the Kubernetes to manage the .spec.replicas field automatically.

    hashtag
    Selector

    .spec.selector is a required field that specifies a for the Pods targeted by this Deployment.

    .spec.selector must match .spec.template.metadata.labels, or it will be rejected by the API.

    In API version apps/v1, .spec.selector and .metadata.labels do not default to .spec.template.metadata.labels if not set. So they must be set explicitly. Also note that .spec.selector is immutable after creation of the Deployment in apps/v1.

    A Deployment may terminate Pods whose labels match the selector if their template is different from .spec.template or if the total number of such Pods exceeds .spec.replicas. It brings up new Pods with .spec.template if the number of Pods is less than the desired number.

    Note: You should not create other Pods whose labels match this selector, either directly, by creating another Deployment, or by creating another controller such as a ReplicaSet or a ReplicationController. If you do so, the first Deployment thinks that it created these other Pods. Kubernetes does not stop you from doing this.

    If you have multiple controllers that have overlapping selectors, the controllers will fight with each other and won't behave correctly.

    hashtag
    Strategy

    .spec.strategy specifies the strategy used to replace old Pods by new ones. .spec.strategy.type can be "Recreate" or "RollingUpdate". "RollingUpdate" is the default value.

    Recreate Deployment

    All existing Pods are killed before new ones are created when .spec.strategy.type==Recreate.

    Note: This will only guarantee Pod termination previous to creation for upgrades. If you upgrade a Deployment, all Pods of the old revision will be terminated immediately. Successful removal is awaited before any Pod of the new revision is created. If you manually delete a Pod, the lifecycle is controlled by the ReplicaSet and the replacement will be created immediately (even if the old Pod is still in a Terminating state). If you need an "at most" guarantee for your Pods, you should consider using a .

    Rolling Update Deployment

    The Deployment updates Pods in a rolling update fashion when .spec.strategy.type==RollingUpdate. You can specify maxUnavailable and maxSurge to control the rolling update process.

    Max Unavailable

    .spec.strategy.rollingUpdate.maxUnavailable is an optional field that specifies the maximum number of Pods that can be unavailable during the update process. The value can be an absolute number (for example, 5) or a percentage of desired Pods (for example, 10%). The absolute number is calculated from percentage by rounding down. The value cannot be 0 if .spec.strategy.rollingUpdate.maxSurge is 0. The default value is 25%.

    For example, when this value is set to 30%, the old ReplicaSet can be scaled down to 70% of desired Pods immediately when the rolling update starts. Once new Pods are ready, old ReplicaSet can be scaled down further, followed by scaling up the new ReplicaSet, ensuring that the total number of Pods available at all times during the update is at least 70% of the desired Pods.

    Max Surge

    .spec.strategy.rollingUpdate.maxSurge is an optional field that specifies the maximum number of Pods that can be created over the desired number of Pods. The value can be an absolute number (for example, 5) or a percentage of desired Pods (for example, 10%). The value cannot be 0 if MaxUnavailable is 0. The absolute number is calculated from the percentage by rounding up. The default value is 25%.

    For example, when this value is set to 30%, the new ReplicaSet can be scaled up immediately when the rolling update starts, such that the total number of old and new Pods does not exceed 130% of desired Pods. Once old Pods have been killed, the new ReplicaSet can be scaled up further, ensuring that the total number of Pods running at any time during the update is at most 130% of desired Pods.

    hashtag
    Progress Deadline Seconds

    .spec.progressDeadlineSeconds is an optional field that specifies the number of seconds you want to wait for your Deployment to progress before the system reports back that the Deployment has - surfaced as a condition with type: Progressing, status: "False". and reason: ProgressDeadlineExceeded in the status of the resource. The Deployment controller will keep retrying the Deployment. This defaults to 600. In the future, once automatic rollback will be implemented, the Deployment controller will roll back a Deployment as soon as it observes such a condition.

    If specified, this field needs to be greater than .spec.minReadySeconds.

    hashtag
    Min Ready Seconds

    .spec.minReadySeconds is an optional field that specifies the minimum number of seconds for which a newly created Pod should be ready without any of its containers crashing, for it to be considered available. This defaults to 0 (the Pod will be considered available as soon as it is ready). To learn more about when a Pod is considered ready, see .

    hashtag
    Revision History Limit

    A Deployment's revision history is stored in the ReplicaSets it controls.

    .spec.revisionHistoryLimit is an optional field that specifies the number of old ReplicaSets to retain to allow rollback. These old ReplicaSets consume resources in etcd and crowd the output of kubectl get rs. The configuration of each Deployment revision is stored in its ReplicaSets; therefore, once an old ReplicaSet is deleted, you lose the ability to rollback to that revision of Deployment. By default, 10 old ReplicaSets will be kept, however its ideal value depends on the frequency and stability of new Deployments.

    More specifically, setting this field to zero means that all old ReplicaSets with 0 replicas will be cleaned up. In this case, a new Deployment rollout cannot be undone, since its revision history is cleaned up.

    hashtag
    Paused

    .spec.paused is an optional boolean field for pausing and resuming a Deployment. The only difference between a paused Deployment and one that is not paused, is that any changes into the PodTemplateSpec of the paused Deployment will not trigger new rollouts as long as it is paused. A Deployment is not paused by default when it is created.

    StatefulSets

    StatefulSet is the workload API object used to manage stateful applications.

    Manages the deployment and scaling of a set of , and provides guarantees about the ordering and uniqueness of these Pods.

    Like a , a StatefulSet manages Pods that are based on an identical container spec. Unlike a Deployment, a StatefulSet maintains a sticky identity for each of its Pods. These pods are created from the same spec, but are not interchangeable: each has a persistent identifier that it maintains across any rescheduling.

    If you want to use storage volumes to provide persistence for your workload, you can use a StatefulSet as part of the solution. Although individual Pods in a StatefulSet are susceptible to failure, the persistent Pod identifiers make it easier to match existing volumes to the new Pods that replace any that have failed.

    hashtag
    Using StatefulSets

    StatefulSets are valuable for applications that require one or more of the following.

    • Stable, unique network identifiers.

    • Stable, persistent storage.

    • Ordered, graceful deployment and scaling.

    In the above, stable is synonymous with persistence across Pod (re)scheduling. If an application doesn't require any stable identifiers or ordered deployment, deletion, or scaling, you should deploy your application using a workload object that provides a set of stateless replicas. or may be better suited to your stateless needs.

    hashtag
    Limitations

    • The storage for a given Pod must either be provisioned by a based on the requested storage class, or pre-provisioned by an admin.

    • Deleting and/or scaling a StatefulSet down will not delete the volumes associated with the StatefulSet. This is done to ensure data safety, which is generally more valuable than an automatic purge of all related StatefulSet resources.

    hashtag
    Components

    The example below demonstrates the components of a StatefulSet.

    In the above example:

    • A Headless Service, named nginx, is used to control the network domain.

    • The StatefulSet, named web, has a Spec that indicates that 3 replicas of the nginx container will be launched in unique Pods.

    • The volumeClaimTemplates

    The name of a StatefulSet object must be a valid .

    hashtag
    Pod Selector

    You must set the .spec.selector field of a StatefulSet to match the labels of its .spec.template.metadata.labels. Failing to specify a matching Pod Selector will result in a validation error during StatefulSet creation.

    hashtag
    Volume Claim Templates

    You can set the .spec.volumeClaimTemplates which can provide stable storage using provisioned by a PersistentVolume Provisioner.

    hashtag
    Minimum ready seconds

    FEATURE STATE: Kubernetes v1.25 [stable]

    .spec.minReadySeconds is an optional field that specifies the minimum number of seconds for which a newly created Pod should be running and ready without any of its containers crashing, for it to be considered available. This is used to check progression of a rollout when using a strategy. This field defaults to 0 (the Pod will be considered available as soon as it is ready). To learn more about when a Pod is considered ready, see .

    hashtag
    Pod Identity

    StatefulSet Pods have a unique identity that consists of an ordinal, a stable network identity, and stable storage. The identity sticks to the Pod, regardless of which node it's (re)scheduled on.

    hashtag
    Ordinal Index

    For a StatefulSet with N , each Pod in the StatefulSet will be assigned an integer ordinal, that is unique over the Set. By default, pods will be assigned ordinals from 0 up through N-1.

    hashtag
    Start ordinal

    FEATURE STATE: Kubernetes v1.27 [beta]

    .spec.ordinals is an optional field that allows you to configure the integer ordinals assigned to each Pod. It defaults to nil. You must enable the StatefulSetStartOrdinal to use this field. Once enabled, you can configure the following options:

    • .spec.ordinals.start: If the .spec.ordinals.start field is set, Pods will be assigned ordinals from .spec.ordinals.start up through .spec.ordinals.start + .spec.replicas - 1.

    hashtag
    Stable Network ID

    Each Pod in a StatefulSet derives its hostname from the name of the StatefulSet and the ordinal of the Pod. The pattern for the constructed hostname is $(statefulset name)-$(ordinal). The example above will create three Pods named web-0,web-1,web-2. A StatefulSet can use a to control the domain of its Pods. The domain managed by this Service takes the form: $(service name).$(namespace).svc.cluster.local, where "cluster.local" is the cluster domain. As each Pod is created, it gets a matching DNS subdomain, taking the form: $(podname).$(governing service domain), where the governing service is defined by the serviceName field on the StatefulSet.

    Depending on how DNS is configured in your cluster, you may not be able to look up the DNS name for a newly-run Pod immediately. This behavior can occur when other clients in the cluster have already sent queries for the hostname of the Pod before it was created. Negative caching (normal in DNS) means that the results of previous failed lookups are remembered and reused, even after the Pod is running, for at least a few seconds.

    If you need to discover Pods promptly after they are created, you have a few options:

    • Query the Kubernetes API directly (for example, using a watch) rather than relying on DNS lookups.

    • Decrease the time of caching in your Kubernetes DNS provider (typically this means editing the config map for CoreDNS, which currently caches for 30 seconds).

    As mentioned in the section, you are responsible for creating the responsible for the network identity of the pods.

    Here are some examples of choices for Cluster Domain, Service name, StatefulSet name, and how that affects the DNS names for the StatefulSet's Pods.

    Cluster Domain
    Service (ns/name)
    StatefulSet (ns/name)
    StatefulSet Domain
    Pod DNS
    Pod Hostname

    Note: Cluster Domain will be set to cluster.local unless .

    hashtag
    Stable Storage

    For each VolumeClaimTemplate entry defined in a StatefulSet, each Pod receives one PersistentVolumeClaim. In the nginx example above, each Pod receives a single PersistentVolume with a StorageClass of my-storage-class and 1 Gib of provisioned storage. If no StorageClass is specified, then the default StorageClass will be used. When a Pod is (re)scheduled onto a node, its volumeMounts mount the PersistentVolumes associated with its PersistentVolume Claims. Note that, the PersistentVolumes associated with the Pods' PersistentVolume Claims are not deleted when the Pods, or StatefulSet are deleted. This must be done manually.

    hashtag
    Pod Name Label

    When the StatefulSet creates a Pod, it adds a label, statefulset.kubernetes.io/pod-name, that is set to the name of the Pod. This label allows you to attach a Service to a specific Pod in the StatefulSet.

    hashtag
    Deployment and Scaling Guarantees

    • For a StatefulSet with N replicas, when Pods are being deployed, they are created sequentially, in order from {0..N-1}.

    • When Pods are being deleted, they are terminated in reverse order, from {N-1..0}.

    • Before a scaling operation is applied to a Pod, all of its predecessors must be Running and Ready.

    The StatefulSet should not specify a pod.Spec.TerminationGracePeriodSeconds of 0. This practice is unsafe and strongly discouraged. For further explanation, please refer to .

    When the nginx example above is created, three Pods will be deployed in the order web-0, web-1, web-2. web-1 will not be deployed before web-0 is , and web-2 will not be deployed until web-1 is Running and Ready. If web-0 should fail, after web-1 is Running and Ready, but before web-2 is launched, web-2 will not be launched until web-0 is successfully relaunched and becomes Running and Ready.

    If a user were to scale the deployed example by patching the StatefulSet such that replicas=1, web-2 would be terminated first. web-1 would not be terminated until web-2 is fully shutdown and deleted. If web-0 were to fail after web-2 has been terminated and is completely shutdown, but prior to web-1's termination, web-1 would not be terminated until web-0 is Running and Ready.

    hashtag
    Pod Management Policies

    StatefulSet allows you to relax its ordering guarantees while preserving its uniqueness and identity guarantees via its .spec.podManagementPolicy field.

    OrderedReady Pod Management

    OrderedReady pod management is the default for StatefulSets. It implements the behavior described .

    Parallel Pod Management

    Parallel pod management tells the StatefulSet controller to launch or terminate all Pods in parallel, and to not wait for Pods to become Running and Ready or completely terminated prior to launching or terminating another Pod. This option only affects the behavior for scaling operations. Updates are not affected.

    hashtag
    Update strategies

    A StatefulSet's .spec.updateStrategy field allows you to configure and disable automated rolling updates for containers, labels, resource request/limits, and annotations for the Pods in a StatefulSet. There are two possible values:

    OnDeleteWhen a StatefulSet's .spec.updateStrategy.type is set to OnDelete, the StatefulSet controller will not automatically update the Pods in a StatefulSet. Users must manually delete Pods to cause the controller to create new Pods that reflect modifications made to a StatefulSet's .spec.template.RollingUpdateThe RollingUpdate update strategy implements automated, rolling updates for the Pods in a StatefulSet. This is the default update strategy.

    hashtag
    Rolling Updates

    When a StatefulSet's .spec.updateStrategy.type is set to RollingUpdate, the StatefulSet controller will delete and recreate each Pod in the StatefulSet. It will proceed in the same order as Pod termination (from the largest ordinal to the smallest), updating each Pod one at a time.

    The Kubernetes control plane waits until an updated Pod is Running and Ready prior to updating its predecessor. If you have set .spec.minReadySeconds (see ), the control plane additionally waits that amount of time after the Pod turns ready, before moving on.

    hashtag
    Partitioned rolling updates

    The RollingUpdate update strategy can be partitioned, by specifying a .spec.updateStrategy.rollingUpdate.partition. If a partition is specified, all Pods with an ordinal that is greater than or equal to the partition will be updated when the StatefulSet's .spec.template is updated. All Pods with an ordinal that is less than the partition will not be updated, and, even if they are deleted, they will be recreated at the previous version. If a StatefulSet's .spec.updateStrategy.rollingUpdate.partition is greater than its .spec.replicas, updates to its .spec.template will not be propagated to its Pods. In most cases you will not need to use a partition, but they are useful if you want to stage an update, roll out a canary, or perform a phased roll out.

    hashtag
    Maximum unavailable Pods

    FEATURE STATE: Kubernetes v1.24 [alpha]

    You can control the maximum number of Pods that can be unavailable during an update by specifying the .spec.updateStrategy.rollingUpdate.maxUnavailable field. The value can be an absolute number (for example, 5) or a percentage of desired Pods (for example, 10%). Absolute number is calculated from the percentage value by rounding it up. This field cannot be 0. The default setting is 1.

    This field applies to all Pods in the range 0 to replicas - 1. If there is any unavailable Pod in the range 0 to replicas - 1, it will be counted towards maxUnavailable.

    Note: The maxUnavailable field is in Alpha stage and it is honored only by API servers that are running with the MaxUnavailableStatefulSet enabled.

    hashtag
    Forced rollback

    When using with the default (OrderedReady), it's possible to get into a broken state that requires manual intervention to repair.

    If you update the Pod template to a configuration that never becomes Running and Ready (for example, due to a bad binary or application-level configuration error), StatefulSet will stop the rollout and wait.

    In this state, it's not enough to revert the Pod template to a good configuration. Due to a , StatefulSet will continue to wait for the broken Pod to become Ready (which never happens) before it will attempt to revert it back to the working configuration.

    After reverting the template, you must also delete any Pods that StatefulSet had already attempted to run with the bad configuration. StatefulSet will then begin to recreate the Pods using the reverted template.

    hashtag
    PersistentVolumeClaim retention

    FEATURE STATE: Kubernetes v1.27 [beta]

    The optional .spec.persistentVolumeClaimRetentionPolicy field controls if and how PVCs are deleted during the lifecycle of a StatefulSet. You must enable the StatefulSetAutoDeletePVC on the API server and the controller manager to use this field. Once enabled, there are two policies you can configure for each StatefulSet:

    whenDeletedconfigures the volume retention behavior that applies when the StatefulSet is deletedwhenScaledconfigures the volume retention behavior that applies when the replica count of the StatefulSet is reduced; for example, when scaling down the set.

    For each policy that you can configure, you can set the value to either Delete or Retain.

    DeleteThe PVCs created from the StatefulSet volumeClaimTemplate are deleted for each Pod affected by the policy. With the whenDeleted policy all PVCs from the volumeClaimTemplate are deleted after their Pods have been deleted. With the whenScaled policy, only PVCs corresponding to Pod replicas being scaled down are deleted, after their Pods have been deleted.Retain (default)PVCs from the volumeClaimTemplate are not affected when their Pod is deleted. This is the behavior before this new feature.

    Bear in mind that these policies only apply when Pods are being removed due to the StatefulSet being deleted or scaled down. For example, if a Pod associated with a StatefulSet fails due to node failure, and the control plane creates a replacement Pod, the StatefulSet retains the existing PVC. The existing volume is unaffected, and the cluster will attach it to the node where the new Pod is about to launch.

    The default for policies is Retain, matching the StatefulSet behavior before this new feature.

    Here is an example policy.

    The StatefulSet adds to its PVCs, which are then deleted by the after the Pod is terminated. This enables the Pod to cleanly unmount all volumes before the PVCs are deleted (and before the backing PV and volume are deleted, depending on the retain policy). When you set the whenDeleted policy to Delete, an owner reference to the StatefulSet instance is placed on all PVCs associated with that StatefulSet.

    The whenScaled policy must delete PVCs only when a Pod is scaled down, and not when a Pod is deleted for another reason. When reconciling, the StatefulSet controller compares its desired replica count to the actual Pods present on the cluster. Any StatefulSet Pod whose id greater than the replica count is condemned and marked for deletion. If the whenScaled policy is Delete, the condemned Pods are first set as owners to the associated StatefulSet template PVCs, before the Pod is deleted. This causes the PVCs to be garbage collected after only the condemned Pods have terminated.

    This means that if the controller crashes and restarts, no Pod will be deleted before its owner reference has been updated appropriate to the policy. If a condemned Pod is force-deleted while the controller is down, the owner reference may or may not have been set up, depending on when the controller crashed. It may take several reconcile loops to update the owner references, so some condemned Pods may have set up owner references and others may not. For this reason we recommend waiting for the controller to come back up, which will verify owner references before terminating Pods. If that is not possible, the operator should verify the owner references on PVCs to ensure the expected objects are deleted when Pods are force-deleted.

    hashtag
    Replicas

    .spec.replicas is an optional field that specifies the number of desired Pods. It defaults to 1.

    Should you manually scale a deployment, example via kubectl scale statefulset statefulset --replicas=X, and then you update that StatefulSet based on a manifest (for example: by running kubectl apply -f statefulset.yaml), then applying that manifest overwrites the manual scaling that you previously did.

    If a (or any similar API for horizontal scaling) is managing scaling for a Statefulset, don't set .spec.replicas. Instead, allow the Kubernetes to manage the .spec.replicas field automatically.

    DaemonSet

    A DaemonSet ensures that all (or some) Nodes run a copy of a Pod. As nodes are added to the cluster, Pods are added to them. As nodes are removed from the cluster, those Pods are garbage collected. Deleting a DaemonSet will clean up the Pods it created.

    Some typical uses of a DaemonSet are:

    • running a cluster storage daemon on every node

    • running a logs collection daemon on every node

    • running a node monitoring daemon on every node

    In a simple case, one DaemonSet, covering all nodes, would be used for each type of daemon. A more complex setup might use multiple DaemonSets for a single type of daemon, but with different flags and/or different memory and cpu requests for different hardware types.

    hashtag
    Writing a DaemonSet Spec

    hashtag
    Create a DaemonSet

    You can describe a DaemonSet in a YAML file. For example, the daemonset.yaml file below describes a DaemonSet that runs the fluentd-elasticsearch Docker image:

    Create a DaemonSet based on the YAML file:

    hashtag
    Required Fields

    As with all other Kubernetes config, a DaemonSet needs apiVersion, kind, and metadata fields. For general information about working with config files, see and .

    The name of a DaemonSet object must be a valid .

    A DaemonSet also needs a section.

    hashtag
    Pod Template

    The .spec.template is one of the required fields in .spec.

    The .spec.template is a . It has exactly the same schema as a , except it is nested and does not have an apiVersion or kind.

    In addition to required fields for a Pod, a Pod template in a DaemonSet has to specify appropriate labels (see ).

    A Pod Template in a DaemonSet must have a equal to Always, or be unspecified, which defaults to Always.

    hashtag
    Pod Selector

    The .spec.selector field is a pod selector. It works the same as the .spec.selector of a .

    You must specify a pod selector that matches the labels of the .spec.template. Also, once a DaemonSet is created, its .spec.selector can not be mutated. Mutating the pod selector can lead to the unintentional orphaning of Pods, and it was found to be confusing to users.

    The .spec.selector is an object consisting of two fields:

    • matchLabels - works the same as the .spec.selector of a .

    • matchExpressions - allows to build more sophisticated selectors by specifying key, list of values and an operator that relates the key and values.

    When the two are specified the result is ANDed.

    The .spec.selector must match the .spec.template.metadata.labels. Config with these two not matching will be rejected by the API.

    hashtag
    Running Pods on select Nodes

    If you specify a .spec.template.spec.nodeSelector, then the DaemonSet controller will create Pods on nodes which match that . Likewise if you specify a .spec.template.spec.affinity, then DaemonSet controller will create Pods on nodes which match that . If you do not specify either, then the DaemonSet controller will create Pods on all nodes.

    hashtag
    How Daemon Pods are scheduled

    A DaemonSet ensures that all eligible nodes run a copy of a Pod. The DaemonSet controller creates a Pod for each eligible node and adds the spec.affinity.nodeAffinity field of the Pod to match the target host. After the Pod is created, the default scheduler typically takes over and then binds the Pod to the target host by setting the .spec.nodeName field. If the new Pod cannot fit on the node, the default scheduler may preempt (evict) some of the existing Pods based on the of the new Pod.

    The user can specify a different scheduler for the Pods of the DaemonSet, by setting the .spec.template.spec.schedulerName field of the DaemonSet.

    The original node affinity specified at the .spec.template.spec.affinity.nodeAffinity field (if specified) is taken into consideration by the DaemonSet controller when evaluating the eligible nodes, but is replaced on the created Pod with the node affinity that matches the name of the eligible node.

    hashtag
    Taints and tolerations

    The DaemonSet controller automatically adds a set of to DaemonSet Pods:

    Toleration key
    Effect
    Details

    You can add your own tolerations to the Pods of a DaemonSet as well, by defining these in the Pod template of the DaemonSet.

    Because the DaemonSet controller sets the node.kubernetes.io/unschedulable:NoSchedule toleration automatically, Kubernetes can run DaemonSet Pods on nodes that are marked as unschedulable.

    If you use a DaemonSet to provide an important node-level function, such as , it is helpful that Kubernetes places DaemonSet Pods on nodes before they are ready. For example, without that special toleration, you could end up in a deadlock situation where the node is not marked as ready because the network plugin is not running there, and at the same time the network plugin is not running on that node because the node is not yet ready.

    hashtag
    Communicating with Daemon Pods

    Some possible patterns for communicating with Pods in a DaemonSet are:

    • Push: Pods in the DaemonSet are configured to send updates to another service, such as a stats database. They do not have clients.

    • NodeIP and Known Port: Pods in the DaemonSet can use a hostPort, so that the pods are reachable via the node IPs. Clients know the list of node IPs somehow, and know the port by convention.

    hashtag
    Updating a DaemonSet

    If node labels are changed, the DaemonSet will promptly add Pods to newly matching nodes and delete Pods from newly not-matching nodes.

    You can modify the Pods that a DaemonSet creates. However, Pods do not allow all fields to be updated. Also, the DaemonSet controller will use the original template the next time a node (even with the same name) is created.

    You can delete a DaemonSet. If you specify --cascade=orphan with kubectl, then the Pods will be left on the nodes. If you subsequently create a new DaemonSet with the same selector, the new DaemonSet adopts the existing Pods. If any Pods need replacing the DaemonSet replaces them according to its updateStrategy.

    You can on a DaemonSet.

    Jobs

    A Job creates one or more Pods and will continue to retry execution of the Pods until a specified number of them successfully terminate. As pods successfully complete, the Job tracks the successful completions. When a specified number of successful completions is reached, the task (ie, Job) is complete. Deleting a Job will clean up the Pods it created. Suspending a Job will delete its active Pods until the Job is resumed again.

    A simple case is to create one Job object in order to reliably run one Pod to completion. The Job object will start a new Pod if the first Pod fails or is deleted (for example due to a node hardware failure or a node reboot).

    You can also use a Job to run multiple Pods in parallel.

    If you want to run a Job (either a single task, or several in parallel) on a schedule, see .

    hashtag
    Running an example Job

    Here is an example Job config. It computes π to 2000 places and prints it out. It takes around 10s to complete.

    You can run the example with this command:

    The output is similar to this:

    Check on the status of the Job with kubectl:

    To view completed Pods of a Job, use kubectl get pods.

    To list all the Pods that belong to a Job in a machine readable form, you can use a command like this:

    The output is similar to this:

    Here, the selector is the same as the selector for the Job. The --output=jsonpath option specifies an expression with the name from each Pod in the returned list.

    View the standard output of one of the pods:

    Another way to view the logs of a Job:

    The output is similar to this:

    hashtag
    Writing a Job spec

    As with all other Kubernetes config, a Job needs apiVersion, kind, and metadata fields.

    When the control plane creates new Pods for a Job, the .metadata.name of the Job is part of the basis for naming those Pods. The name of a Job must be a valid value, but this can produce unexpected results for the Pod hostnames. For best compatibility, the name should follow the more restrictive rules for a . Even when the name is a DNS subdomain, the name must be no longer than 63 characters.

    A Job also needs a .

    hashtag
    Job Labels

    Job labels will have batch.kubernetes.io/ prefix for job-name and controller-uid.

    hashtag
    Pod Template

    The .spec.template is the only required field of the .spec.

    The .spec.template is a . It has exactly the same schema as a , except it is nested and does not have an apiVersion or kind.

    In addition to required fields for a Pod, a pod template in a Job must specify appropriate labels (see ) and an appropriate restart policy.

    Only a equal to Never or OnFailure is allowed.

    hashtag
    Pod selector

    The .spec.selector field is optional. In almost all cases you should not specify it. See section .

    hashtag
    Parallel execution for Jobs

    There are three main types of task suitable to run as a Job:

    1. Non-parallel Jobs

      • normally, only one Pod is started, unless the Pod fails.

      • the Job is complete as soon as its Pod terminates successfully.

    For a non-parallel Job, you can leave both .spec.completions and .spec.parallelism unset. When both are unset, both are defaulted to 1.

    For a fixed completion count Job, you should set .spec.completions to the number of completions needed. You can set .spec.parallelism, or leave it unset and it will default to 1.

    For a work queue Job, you must leave .spec.completions unset, and set .spec.parallelism to a non-negative integer.

    For more information about how to make use of the different types of job, see the section.

    Controlling parallelism

    The requested parallelism (.spec.parallelism) can be set to any non-negative value. If it is unspecified, it defaults to 1. If it is specified as 0, then the Job is effectively paused until it is increased.

    Actual parallelism (number of pods running at any instant) may be more or less than requested parallelism, for a variety of reasons:

    • For fixed completion count Jobs, the actual number of pods running in parallel will not exceed the number of remaining completions. Higher values of .spec.parallelism are effectively ignored.

    • For work queue Jobs, no new Pods are started after any Pod has succeeded -- remaining Pods are allowed to complete, however.

    hashtag
    Completion mode

    FEATURE STATE: Kubernetes v1.24 [stable]

    Jobs with fixed completion count - that is, jobs that have non null .spec.completions - can have a completion mode that is specified in .spec.completionMode:

    • NonIndexed (default): the Job is considered complete when there have been .spec.completions successfully completed Pods. In other words, each Pod completion is homologous to each other. Note that Jobs that have null .spec.completions are implicitly NonIndexed.

    • Indexed: the Pods of a Job get an associated completion index from 0 to .spec.completions-1

    Note: Although rare, more than one Pod could be started for the same index (due to various reasons such as node failures, kubelet restarts, or Pod evictions). In this case, only the first Pod that completes successfully will count towards the completion count and update the status of the Job. The other Pods that are running or completed for the same index will be deleted by the Job controller once they are detected.

    hashtag
    Handling Pod and container failures

    A container in a Pod may fail for a number of reasons, such as because the process in it exited with a non-zero exit code, or the container was killed for exceeding a memory limit, etc. If this happens, and the .spec.template.spec.restartPolicy = "OnFailure", then the Pod stays on the node, but the container is re-run. Therefore, your program needs to handle the case when it is restarted locally, or else specify .spec.template.spec.restartPolicy = "Never". See for more information on restartPolicy.

    An entire Pod can also fail, for a number of reasons, such as when the pod is kicked off the node (node is upgraded, rebooted, deleted, etc.), or if a container of the Pod fails and the .spec.template.spec.restartPolicy = "Never". When a Pod fails, then the Job controller starts a new Pod. This means that your application needs to handle the case when it is restarted in a new pod. In particular, it needs to handle temporary files, locks, incomplete output and the like caused by previous runs.

    By default, each pod failure is counted towards the .spec.backoffLimit limit, see . However, you can customize handling of pod failures by setting the Job's .

    Note that even if you specify .spec.parallelism = 1 and .spec.completions = 1 and .spec.template.spec.restartPolicy = "Never", the same program may sometimes be started twice.

    If you do specify .spec.parallelism and .spec.completions both greater than 1, then there may be multiple pods running at once. Therefore, your pods must also be tolerant of concurrency.

    When the PodDisruptionConditions and JobPodFailurePolicy are both enabled, and the .spec.podFailurePolicy field is set, the Job controller does not consider a terminating Pod (a pod that has a .metadata.deletionTimestamp field set) as a failure until that Pod is terminal (its .status.phase is Failed or Succeeded). However, the Job controller creates a replacement Pod as soon as the termination becomes apparent. Once the pod terminates, the Job controller evaluates .backoffLimit and .podFailurePolicy for the relevant Job, taking this now-terminated Pod into consideration.

    If either of these requirements is not satisfied, the Job controller counts a terminating Pod as an immediate failure, even if that Pod later terminates with phase: "Succeeded".

    hashtag
    Pod backoff failure policy

    There are situations where you want to fail a Job after some amount of retries due to a logical error in configuration etc. To do so, set .spec.backoffLimit to specify the number of retries before considering a Job as failed. The back-off limit is set by default to 6. Failed Pods associated with the Job are recreated by the Job controller with an exponential back-off delay (10s, 20s, 40s ...) capped at six minutes.

    The number of retries is calculated in two ways:

    • The number of Pods with .status.phase = "Failed".

    • When using restartPolicy = "OnFailure", the number of retries in all the containers of Pods with .status.phase equal to Pending or Running.

    If either of the calculations reaches the .spec.backoffLimit, the Job is considered failed.

    Note: If your job has restartPolicy = "OnFailure", keep in mind that your Pod running the Job will be terminated once the job backoff limit has been reached. This can make debugging the Job's executable more difficult. We suggest setting restartPolicy = "Never" when debugging the Job or using a logging system to ensure output from failed Jobs is not lost inadvertently.

    hashtag
    Pod failure policy

    FEATURE STATE: Kubernetes v1.26 [beta]Note: You can only configure a Pod failure policy for a Job if you have the JobPodFailurePolicy enabled in your cluster. Additionally, it is recommended to enable the PodDisruptionConditions feature gate in order to be able to detect and handle Pod disruption conditions in the Pod failure policy (see also: ). Both feature gates are available in Kubernetes 1.27.

    A Pod failure policy, defined with the .spec.podFailurePolicy field, enables your cluster to handle Pod failures based on the container exit codes and the Pod conditions.

    In some situations, you may want to have a better control when handling Pod failures than the control provided by the , which is based on the Job's .spec.backoffLimit. These are some examples of use cases:

    • To optimize costs of running workloads by avoiding unnecessary Pod restarts, you can terminate a Job as soon as one of its Pods fails with an exit code indicating a software bug.

    • To guarantee that your Job finishes even if there are disruptions, you can ignore Pod failures caused by disruptions (such , or -based eviction) so that they don't count towards the .spec.backoffLimit limit of retries.

    You can configure a Pod failure policy, in the .spec.podFailurePolicy field, to meet the above use cases. This policy can handle Pod failures based on the container exit codes and the Pod conditions.

    Here is a manifest for a Job that defines a podFailurePolicy:

    In the example above, the first rule of the Pod failure policy specifies that the Job should be marked failed if the main container fails with the 42 exit code. The following are the rules for the main container specifically:

    • an exit code of 0 means that the container succeeded

    • an exit code of 42 means that the entire Job failed

    • any other exit code represents that the container failed, and hence the entire Pod. The Pod will be re-created if the total number of restarts is below backoffLimit. If the backoffLimit

    Note: Because the Pod template specifies a restartPolicy: Never, the kubelet does not restart the main container in that particular Pod.

    The second rule of the Pod failure policy, specifying the Ignore action for failed Pods with condition DisruptionTarget excludes Pod disruptions from being counted towards the .spec.backoffLimit limit of retries.

    Note: If the Job failed, either by the Pod failure policy or Pod backoff failure policy, and the Job is running multiple Pods, Kubernetes terminates all the Pods in that Job that are still Pending or Running.

    These are some requirements and semantics of the API:

    • if you want to use a .spec.podFailurePolicy field for a Job, you must also define that Job's pod template with .spec.restartPolicy set to Never.

    • the Pod failure policy rules you specify under spec.podFailurePolicy.rules are evaluated in order. Once a rule matches a Pod failure, the remaining rules are ignored. When no rule matches the Pod failure, the default handling applies.

    Note: When you use a podFailurePolicy, the job controller only matches Pods in the Failed phase. Pods with a deletion timestamp that are not in a terminal phase (Failed or Succeeded) are considered still terminating. This implies that terminating pods retain a until they reach a terminal phase. Since Kubernetes 1.27, Kubelet transitions deleted pods to a terminal phase (see: ). This ensures that deleted pods have their finalizers removed by the Job controller.

    hashtag
    Job termination and cleanup

    When a Job completes, no more Pods are created, but the Pods are not deleted either. Keeping them around allows you to still view the logs of completed pods to check for errors, warnings, or other diagnostic output. The job object also remains after it is completed so that you can view its status. It is up to the user to delete old jobs after noting their status. Delete the job with kubectl (e.g. kubectl delete jobs/pi or kubectl delete -f ./job.yaml). When you delete the job using kubectl, all the pods it created are deleted too.

    By default, a Job will run uninterrupted unless a Pod fails (restartPolicy=Never) or a Container exits in error (restartPolicy=OnFailure), at which point the Job defers to the .spec.backoffLimit described above. Once .spec.backoffLimit has been reached the Job will be marked as failed and any running Pods will be terminated.

    Another way to terminate a Job is by setting an active deadline. Do this by setting the .spec.activeDeadlineSeconds field of the Job to a number of seconds. The activeDeadlineSeconds applies to the duration of the job, no matter how many Pods are created. Once a Job reaches activeDeadlineSeconds, all of its running Pods are terminated and the Job status will become type: Failed with reason: DeadlineExceeded.

    Note that a Job's .spec.activeDeadlineSeconds takes precedence over its .spec.backoffLimit. Therefore, a Job that is retrying one or more failed Pods will not deploy additional Pods once it reaches the time limit specified by activeDeadlineSeconds, even if the backoffLimit is not yet reached.

    Example:

    Note that both the Job spec and the within the Job have an activeDeadlineSeconds field. Ensure that you set this field at the proper level.

    Keep in mind that the restartPolicy applies to the Pod, and not to the Job itself: there is no automatic Job restart once the Job status is type: Failed. That is, the Job termination mechanisms activated with .spec.activeDeadlineSeconds and .spec.backoffLimit result in a permanent Job failure that requires manual intervention to resolve.

    hashtag
    Clean up finished jobs automatically

    Finished Jobs are usually no longer needed in the system. Keeping them around in the system will put pressure on the API server. If the Jobs are managed directly by a higher level controller, such as , the Jobs can be cleaned up by CronJobs based on the specified capacity-based cleanup policy.

    hashtag
    TTL mechanism for finished Jobs

    FEATURE STATE: Kubernetes v1.23 [stable]

    Another way to clean up finished Jobs (either Complete or Failed) automatically is to use a TTL mechanism provided by a for finished resources, by specifying the .spec.ttlSecondsAfterFinished field of the Job.

    When the TTL controller cleans up the Job, it will delete the Job cascadingly, i.e. delete its dependent objects, such as Pods, together with the Job. Note that when the Job is deleted, its lifecycle guarantees, such as finalizers, will be honored.

    For example:

    The Job pi-with-ttl will be eligible to be automatically deleted, 100 seconds after it finishes.

    If the field is set to 0, the Job will be eligible to be automatically deleted immediately after it finishes. If the field is unset, this Job won't be cleaned up by the TTL controller after it finishes.

    Note:

    It is recommended to set ttlSecondsAfterFinished field because unmanaged jobs (Jobs that you created directly, and not indirectly through other workload APIs such as CronJob) have a default deletion policy of orphanDependents causing Pods created by an unmanaged Job to be left around after that Job is fully deleted. Even though the eventually the Pods from a deleted Job after they either fail or complete, sometimes those lingering pods may cause cluster performance degradation or in worst case cause the cluster to go offline due to this degradation.

    You can use and to place a cap on the amount of resources that a particular namespace can consume.

    hashtag
    Job patterns

    The Job object can be used to support reliable parallel execution of Pods. The Job object is not designed to support closely-communicating parallel processes, as commonly found in scientific computing. It does support parallel processing of a set of independent but related work items. These might be emails to be sent, frames to be rendered, files to be transcoded, ranges of keys in a NoSQL database to scan, and so on.

    In a complex system, there may be multiple different sets of work items. Here we are just considering one set of work items that the user wants to manage together — a batch job.

    There are several different patterns for parallel computation, each with strengths and weaknesses. The tradeoffs are:

    • One Job object for each work item, vs. a single Job object for all work items. The latter is better for large numbers of work items. The former creates some overhead for the user and for the system to manage large numbers of Job objects.

    • Number of pods created equals number of work items, vs. each Pod can process multiple work items. The former typically requires less modification to existing code and containers. The latter is better for large numbers of work items, for similar reasons to the previous bullet.

    • Several approaches use a work queue. This requires running a queue service, and modifications to the existing program or container to make it use the work queue. Other approaches are easier to adapt to an existing containerised application.

    The tradeoffs are summarized here, with columns 2 to 4 corresponding to the above tradeoffs. The pattern names are also links to examples and more detailed description.

    Pattern
    Single Job object
    Fewer pods than work items?
    Use app unmodified?

    When you specify completions with .spec.completions, each Pod created by the Job controller has an identical . This means that all pods for a task will have the same command line and the same image, the same volumes, and (almost) the same environment variables. These patterns are different ways to arrange for pods to work on different things.

    This table shows the required settings for .spec.parallelism and .spec.completions for each of the patterns. Here, W is the number of work items.

    hashtag
    Advanced usage

    hashtag
    Suspending a Job

    FEATURE STATE: Kubernetes v1.24 [stable]

    When a Job is created, the Job controller will immediately begin creating Pods to satisfy the Job's requirements and will continue to do so until the Job is complete. However, you may want to temporarily suspend a Job's execution and resume it later, or start Jobs in suspended state and have a custom controller decide later when to start them.

    To suspend a Job, you can update the .spec.suspend field of the Job to true; later, when you want to resume it again, update it to false. Creating a Job with .spec.suspend set to true will create it in the suspended state.

    When a Job is resumed from suspension, its .status.startTime field will be reset to the current time. This means that the .spec.activeDeadlineSeconds timer will be stopped and reset when a Job is suspended and resumed.

    When you suspend a Job, any running Pods that don't have a status of Completed will be . with a SIGTERM signal. The Pod's graceful termination period will be honored and your Pod must handle this signal in this period. This may involve saving progress for later or undoing changes. Pods terminated this way will not count towards the Job's completions count.

    An example Job definition in the suspended state can be like so:

    You can also toggle Job suspension by patching the Job using the command line.

    Suspend an active Job:

    Resume a suspended Job:

    The Job's status can be used to determine if a Job is suspended or has been suspended in the past:

    The Job condition of type "Suspended" with status "True" means the Job is suspended; the lastTransitionTime field can be used to determine how long the Job has been suspended for. If the status of that condition is "False", then the Job was previously suspended and is now running. If such a condition does not exist in the Job's status, the Job has never been stopped.

    Events are also created when the Job is suspended and resumed:

    The last four events, particularly the "Suspended" and "Resumed" events, are directly a result of toggling the .spec.suspend field. In the time between these two events, we see that no Pods were created, but Pod creation restarted as soon as the Job was resumed.

    hashtag
    Mutable Scheduling Directives

    FEATURE STATE: Kubernetes v1.27 [stable]

    In most cases a parallel job will want the pods to run with constraints, like all in the same zone, or all either on GPU model x or y but not a mix of both.

    The field is the first step towards achieving those semantics. Suspend allows a custom queue controller to decide when a job should start; However, once a job is unsuspended, a custom queue controller has no influence on where the pods of a job will actually land.

    This feature allows updating a Job's scheduling directives before it starts, which gives custom queue controllers the ability to influence pod placement while at the same time offloading actual pod-to-node assignment to kube-scheduler. This is allowed only for suspended Jobs that have never been unsuspended before.

    The fields in a Job's pod template that can be updated are node affinity, node selector, tolerations, labels, annotations and .

    hashtag
    Specifying your own Pod selector

    Normally, when you create a Job object, you do not specify .spec.selector. The system defaulting logic adds this field when the Job is created. It picks a selector value that will not overlap with any other jobs.

    However, in some cases, you might need to override this automatically set selector. To do this, you can specify the .spec.selector of the Job.

    Be very careful when doing this. If you specify a label selector which is not unique to the pods of that Job, and which matches unrelated Pods, then pods of the unrelated job may be deleted, or this Job may count other Pods as completing it, or one or both Jobs may refuse to create Pods or run to completion. If a non-unique selector is chosen, then other controllers (e.g. ReplicationController) and their Pods may behave in unpredictable ways too. Kubernetes will not stop you from making a mistake when specifying .spec.selector.

    Here is an example of a case when you might want to use this feature.

    Say Job old is already running. You want existing Pods to keep running, but you want the rest of the Pods it creates to use a different pod template and for the Job to have a new name. You cannot update the Job because these fields are not updatable. Therefore, you delete Job old but leave its pods running, using kubectl delete jobs/old --cascade=orphan. Before deleting it, you make a note of what selector it uses:

    The output is similar to this:

    Then you create a new Job with name new and you explicitly specify the same selector. Since the existing Pods have label batch.kubernetes.io/controller-uid=a8f3d00d-c6d2-11e5-9f87-42010af00002, they are controlled by Job new as well.

    You need to specify manualSelector: true in the new Job since you are not using the selector that the system normally generates for you automatically.

    The new Job itself will have a different uid from a8f3d00d-c6d2-11e5-9f87-42010af00002. Setting manualSelector: true tells the system that you know what you are doing and to allow this mismatch.

    hashtag
    Job tracking with finalizers

    FEATURE STATE: Kubernetes v1.26 [stable]Note: The control plane doesn't track Jobs using finalizers, if the Jobs were created when the feature gate JobTrackingWithFinalizers was disabled, even after you upgrade the control plane to 1.26.

    The control plane keeps track of the Pods that belong to any Job and notices if any such Pod is removed from the API server. To do that, the Job controller creates Pods with the finalizer batch.kubernetes.io/job-tracking. The controller removes the finalizer only after the Pod has been accounted for in the Job status, allowing the Pod to be removed by other controllers or users.

    Jobs created before upgrading to Kubernetes 1.26 or before the feature gate JobTrackingWithFinalizers is enabled are tracked without the use of Pod finalizers. The Job updates the status counters for succeeded and failed Pods based only on the Pods that exist in the cluster. The contol plane can lose track of the progress of the Job if Pods are deleted from the cluster.

    You can determine if the control plane is tracking a Job using Pod finalizers by checking if the Job has the annotation batch.kubernetes.io/job-tracking. You should not manually add or remove this annotation from Jobs. Instead, you can recreate the Jobs to ensure they are tracked using Pod finalizers.

    hashtag
    Elastic Indexed Jobs

    FEATURE STATE: Kubernetes v1.27 [beta]

    You can scale Indexed Jobs up or down by mutating both .spec.parallelism and .spec.completions together such that .spec.parallelism == .spec.completions. When the ElasticIndexedJob on the is disabled, .spec.completions is immutable.

    Use cases for elastic Indexed Jobs include batch workloads which require scaling an indexed Job, such as MPI, Horovord, Ray, and PyTorch training jobs.

    Kubernetes Network

    Moving from physical networks using switches, routers, and ethernet cables to virtual networks using software-defined networks (SDN) and virtual interfaces involves a slight learning curve. Of course, the principles remain the same, but there are different specifications and best practices. Kubernetes has its own set of rules, and if you're dealing with containers and the cloud, it helps to understand how Kubernetes networking works.

    The Kubernetes Network Model has a few general rules to keep in mind:

    1. Every Pod gets its own IP address: There should be no need to create links between Pods and no need to map container ports to host ports.

    Application Deployment Process

    circle-info

    Application Deployment Process: Start Date : 15 Sep 2023

    End Date : 20Sep 2023

    Day One :

    install Proxmox on an OVH server with a public IP and then install and configure Ubuntu as a virtual machine, you can follow these steps:

    Kubernetes ConfigMap and Secret

    hashtag
    Kubernetes Configmaps

    If we have many object files, it won’t be easy to manage the environment data stored within the query files. We can take this information out of the pod definition file and execute it centrally using Configuration Maps. ConfigMaps are used to provide configuration data in key-value pairs in K8s. There are two phases involved in configuring ConfigMaps. The first is to create the ConfigMaps, and the second to inject them into the pod.

    ConfigMaps

    1. Provision OVH Server: Access your OVH account and provision a server with the desired specifications, including a public IP address.

    2. Connect to the Server: Once the server is provisioned, you can connect to it via SSH using a terminal application like Terminal (Mac/Linux). Use the server's public IP address and the SSH credentials provided by OVH.

    3. Install Proxmox VE: Proxmox VE is a server virtualization platform that will allow you to create and manage virtual machines. Follow the official Proxmox VE installation guide specific to your server's operating system. Typically, it involves running a script provided by Proxmox to install the necessary packages.

    4. Access Proxmox Web Interface: Once Proxmox VE is installed, access its web interface by opening a web browser and entering the server's IP address followed by the default port 8006. For example, https://<server_ip>:8006. Accept any security warnings and log in using the default username root and the password set during the Proxmox installation.

    5. Configure Network: In the Proxmox web interface, navigate to "Datacenter" -> "Network" -> "VM Network" and configure the network settings for your virtual machines. Ensure the public IP address assigned to your OVH server is properly configured.

    6. Create Virtual Machine (VM): In the Proxmox web interface, click on "Create VM" to create a new virtual machine. Follow the wizard to specify the VM settings, such as the amount of RAM, CPU cores, disk space, and networking. Choose Ubuntu as the guest OS template.

    7. Install Ubuntu on the VM: After creating the VM, select it in the Proxmox interface and click on "Console" to access the virtual machine's console. Start the VM and mount the Ubuntu ISO image to perform the installation. Follow the Ubuntu installation process, configuring options like language, partitioning, and user credentials.

    8. Configure Ubuntu: Once Ubuntu is installed, log in to the virtual machine and perform any necessary configurations. Update the system packages using sudo apt update and sudo apt upgrade. Install additional software, set up firewall rules, configure network interfaces, etc., as per your requirements.

    9. Access Ubuntu VM: To access the Ubuntu VM from your local machine, you can use SSH or remote desktop tools like VNC. Ensure you have network connectivity between your local machine and the OVH server.

    Day TWO :

    1. Containerize application: Package your application and its dependencies into a container image. Kubernetes uses containers to run and manage applications. You can use tools like Docker to create container images.

    2. Create Kubernetes manifests: Kubernetes uses YAML or JSON files called manifests to define the desired state of your application. Manifests describe the resources that Kubernetes should create and manage, such as pods, services, deployments, and ingress rules. You need to create these manifests to define your application's structure, dependencies, and configurations.

    3. Define a Deployment: A Deployment is a Kubernetes resource that manages the lifecycle of your application. It ensures that the desired number of instances (replicas) of your application are running and handles updates and rollbacks. You define a Deployment in your manifest file, specifying details like the container image, replicas, labels, and environment variables.

    4. Apply the manifests: Use the kubectl apply command to apply your Kubernetes manifests to the cluster. This command creates or updates the specified resources based on the desired state defined in the manifests.

    5. Verify the deployment: After applying the manifests, you can use kubectl commands to verify the status of your deployment. For example, kubectl get pods shows the running pods, kubectl get deployments shows the status of the deployments, and kubectl logs <pod-name> retrieves the logs of a specific pod.

    6. Expose the application: To make your application accessible from outside the cluster, you'll need to expose it using a Service. A Service is a Kubernetes resource that provides a stable network endpoint to access your application. There are different types of Services, such as ClusterIP, NodePort, and LoadBalancer. You define and create a Service in your manifest file.

    7. Scale and update the deployment: Kubernetes allows you to scale your application horizontally by adjusting the number of replicas in your Deployment. You can use the kubectl scale command to scale your application. To update your application, you modify the Deployment's manifest file with the new version or configuration and apply the changes using kubectl apply again.

    8. Monitor and manage: Kubernetes provides various tools and approaches for monitoring and managing your application. You can use kubectl commands, Kubernetes Dashboard, or third-party monitoring tools to monitor the health, resource usage, and logs of your application.

    Day Three :

    build a setup that includes Amazon S3 for Laravel media storage, Amazon CloudFront for content delivery, and Amazon SES for email integration in a Laravel application, you can follow these steps:

    1. Set up an AWS Account: If you don't already have one, create an AWS account at https://aws.amazon.comarrow-up-right and ensure you have the necessary permissions to create and manage services like S3, CloudFront, and SES.

    2. Configure Laravel: Install and configure Laravel for your application. This involves setting up the database connection, configuring the mail driver (to use SES later), and any other necessary Laravel configurations.

    3. Set up Amazon S3: Create an S3 bucket in the AWS Management Console. This bucket will store your media files. Ensure you have the appropriate permissions to access the bucket. You may need to create an IAM user and attach the necessary policies.

    4. Install and Configure Laravel S3 Driver: Install the league/flysystem-aws-s3-v3 package through Composer to enable Laravel's S3 driver. Configure the S3 driver in Laravel's filesystems.php configuration file, specifying the S3 bucket and credentials.

    5. Upload and Retrieve Media: In your Laravel application, use the storage facade to upload and retrieve media files. For example, you can use Storage::put() to upload files to S3 and Storage::url() to generate URLs for accessing the files.

    6. Set up Amazon CloudFront: Create a CloudFront distribution in the AWS Management Console. Configure CloudFront to use your S3 bucket as the origin and specify the desired settings, such as caching, SSL, and custom domain names. CloudFront acts as a content delivery network (CDN) to cache and deliver your media files globally.

    7. Integrate CloudFront URLs in Laravel: Replace the direct S3 URLs in your Laravel application with the CloudFront URLs generated for your media files. This ensures that files are served through CloudFront for faster and more efficient delivery.

    8. Set up Amazon SES: In the AWS Management Console, create an SES (Simple Email Service) configuration, verify your domain or email addresses, and configure the necessary email settings, such as DKIM and SPF records.

    9. Configure Laravel Mail: Update Laravel's mail driver configuration to use SES. Modify the mail.php configuration file and specify the SES SMTP credentials and region.

    10. Send Emails: Use Laravel's built-in mail functionality (Mail facade) to send emails from your application. Laravel will use SES as the underlying mail transport.

    11. Test and Verify: Test the media upload/download functionality and email sending from your Laravel application to ensure everything is working as expected. Monitor logs and error messages to identify and resolve any issues.

    Day Four :

    1. Connect a GitHub Repository:GitHub reposito y application's source code. Initialize the repository with your project files and push them to the remote repository.

    2. Choose a CI/CD Platform: Select a CI/CD platform that integrates well with GitHub. Some popular options include devtron .

    3. Configure CI/CD with GitHub Actions: Create a Dockerfile , nginx conf and supervisor.sh directory in your GitHub repository. Inside this directory, create a YAML file (e.g., ci-cd.yaml) to define your CI/CD workflow. Configure the workflow to trigger on specific events, such as a push to the master branch or a pull request. Define the necessary steps, such as building the application, running tests, and creating a build artifact.

    4. Define Environment-Specific Configurations: Determine the necessary configurations for your staging and production environments. This may include environment variables, database connections, and other settings specifi

    5. Set up Staging Environment: Create a staging environment using Devtron or any other Kubernetes deployment tool of your choice. Devtron simplifies deployment on Kubernetes by providing a user-friendly interface and automation. Configure the necessary Kubernetes resources, such as namespaces, deployments, services, and ingress rules, to create your staging environment.

    6. Configure Deployment Workflow: Modify your CI/CD workflow to include the deployment of your application to the staging environment. This involves building a Docker image, pushing it to a container registry like Docker Hub or Amazon ECR, and deploying the image to your staging environment using Devtron or Kubernetes manifest files.

    7. Test and Verify Staging Environment: Run tests and perform manual verification to ensure that the staging environment is functioning correctly. This includes testing application functionality, performance, and integration with any dependent services.

    8. Set up Production Environment: Create a production environment using Devtron or Kubernetes in a similar manner to the staging environment. Configure the necessary Kubernetes resources according to your production requirements, such as scaling, high availability, and security.

    9. Configure Production Deployment Workflow: Modify your CI/CD workflow to include the deployment of your application to the production environment. This may involve additional steps for promoting the application from the staging environment to production, such as manual approval gates or specific branching strategies.

    10. Test and Verify Production Environment: Run tests and perform thorough verification to ensure that the production environment is functioning correctly. This includes testing application functionality, security, performance, and any other critical aspects.

    11. Monitor and Manage: Implement monitoring and logging solutions to gain insights into your application's performance and health in both staging and production environments. Utilize Devtron's monitoring capabilities or integrate with third-party tools like Prometheus or Grafana.

    Day Five :

    Build a data protection process for a MySQL database and Laravel media files stored in an S3 bucket with a lifecycle policy without encryption, you can follow these steps:

    1. Backup MySQL Database: Implement a regular backup strategy for your MySQL database to protect against data loss. Use tools like mysqldump or database backup services to create automated backups at scheduled intervals. Store the backups in a secure location, such as a separate server or cloud storage.

    2. Store Laravel Media Files in S3: Configure your Laravel application to store media files in an S3 bucket. Set up the necessary credentials and access policies to ensure secure access to the bucket. This allows you to offload the storage of media files to a scalable and durable object storage service.

    3. Enable Server-Side Logging: Enable server-side logging for the S3 bucket to capture access logs. This will help you monitor and track any unauthorized access attempts or suspicious activities related to your media files.

    4. Configure Lifecycle Policy: Define a lifecycle policy for your S3 bucket to manage the lifecycle of the media files. The lifecycle policy can specify rules to transition or expire objects based on criteria such as age, object size, or specific prefixes. For example, you can set rules to automatically move files to Glacier storage after a certain period or delete files that have reached their retention period.

    5. Enable Versioning: Enable versioning for the S3 bucket to preserve multiple versions of the media files. This provides an additional layer of protection by allowing you to restore previous versions of files in case of accidental deletion or corruption.

    6. Implement Access Controls: Apply appropriate access controls to your MySQL database and the S3 bucket to restrict unauthorized access..

    7. Monitor and Test: Regularly monitor the backup process, database integrity, and S3 storage to ensure everything is functioning correctly. Perform periodic tests to restore data from backups and validate the integrity of the restored data.

    8. Disaster Recovery Plan: Develop a comprehensive disaster recovery plan that includes steps to restore the MySQL database and media files from backups in case of data loss or system failure. Document the procedures and regularly review and test the plan to ensure its effectiveness.

    9. Regularly Update and Patch: Keep your MySQL database, Laravel application, and server infrastructure up to date with the latest security patches and updates. Regularly review and apply Laravel framework updates and security best practices to protect against vulnerabilities.

    If the pods' creation times differ, the pod that was created more recently comes before the older pod (the creation times are bucketed on an integer log scale when the LogarithmicScaleDown feature gatearrow-up-right is enabled)

  • Scale up the Deployment to facilitate more loadarrow-up-right.

  • Pause the rollout of a Deploymentarrow-up-right to apply multiple fixes to its PodTemplateSpec and then resume it to start a new rollout.

  • Use the status of the Deploymentarrow-up-right as an indicator that a rollout has stuck.

  • Clean up older ReplicaSetsarrow-up-right that you don't need anymore.

  • The .spec.selector field defines how the created ReplicaSet finds which Pods to manage. In this case, you select a label that is defined in the Pod template (app: nginx). However, more sophisticated selection rules are possible, as long as the Pod template itself satisfies the rule.

    Note: The .spec.selector.matchLabels field is a map of {key,value} pairs. A single {key,value} in the matchLabels map is equivalent to an element of matchExpressions, whose key field is "key", the operator is "In", and the values array contains only "value". All of the requirements, from both matchLabels and matchExpressions, must be satisfied in order to match.

  • The template field contains the following sub-fields:

    • The Pods are labeled app: nginxusing the .metadata.labels field.

    • The Pod template's specification, or .template.spec field, indicates that the Pods run one container, nginx, which runs the nginx image at version 1.14.2.

    • Create one container and name it nginx using the .spec.template.spec.containers[0].name field.

  • NAME lists the names of the Deployments in the namespace.

  • READY displays how many replicas of the application are available to your users. It follows the pattern ready/desired.

  • UP-TO-DATE displays the number of replicas that have been updated to achieve the desired state.

  • AVAILABLE displays how many replicas of the application are available to your users.

  • AGE displays the amount of time that the application has been running.

  • Notice how the number of desired replicas is 3 according to .spec.replicas field.

  • To see the Deployment rollout status, run kubectl rollout status deployment/nginx-deployment.

    The output is similar to:

  • Run the kubectl get deployments again a few seconds later. The output is similar to this:

    Notice that the Deployment has created all three replicas, and all replicas are up-to-date (they contain the latest Pod template) and available.

  • To see the ReplicaSet (rs) created by the Deployment, run kubectl get rs. The output is similar to this:

    ReplicaSet output shows the following fields:

    • NAME lists the names of the ReplicaSets in the namespace.

    • DESIRED displays the desired number of replicas of the application, which you define when you create the Deployment. This is the desired state.

    • CURRENT displays how many replicas are currently running.

    • READY displays how many replicas of the application are available to your users.

    • AGE displays the amount of time that the application has been running.

    Notice that the name of the ReplicaSet is always formatted as [DEPLOYMENT-NAME]-[HASH]. This name will become the basis for the Pods which are created.

    The HASH string is the same as the pod-template-hash label on the ReplicaSet.

  • To see the labels automatically generated for each Pod, run kubectl get pods --show-labels. The output is similar to:

    The created ReplicaSet ensures that there are three nginx Pods.

  • The output is similar to:

    Alternatively, you can edit the Deployment and change .spec.template.spec.containers[0].image from nginx:1.14.2 to nginx:1.16.1:

    The output is similar to:

  • To see the rollout status, run:

    The output is similar to this:

    or

  • Running get pods should now show only the new Pods:

    The output is similar to this:

    Next time you want to update these Pods, you only need to update the Deployment's Pod template again.

    Deployment ensures that only a certain number of Pods are down while they are being updated. By default, it ensures that at least 75% of the desired number of Pods are up (25% max unavailable).

    Deployment also ensures that only a certain number of Pods are created above the desired number of Pods. By default, it ensures that at most 125% of the desired number of Pods are up (25% max surge).

    For example, if you look at the above Deployment closely, you will see that it first creates a new Pod, then deletes an old Pod, and creates another new one. It does not kill old Pods until a sufficient number of new Pods have come up, and does not create new Pods until a sufficient number of old Pods have been killed. It makes sure that at least 3 Pods are available and that at max 4 Pods in total are available. In case of a Deployment with 4 replicas, the number of Pods would be between 3 and 5.

  • Get details of your Deployment:

    The output is similar to this:

    Here you see that when you first created the Deployment, it created a ReplicaSet (nginx-deployment-2035384211) and scaled it up to 3 replicas directly. When you updated the Deployment, it created a new ReplicaSet (nginx-deployment-1564180365) and scaled it up to 1 and waited for it to come up. Then it scaled down the old ReplicaSet to 2 and scaled up the new ReplicaSet to 2 so that at least 3 Pods were available and at most 4 Pods were created at all times. It then continued scaling up and down the new and the old ReplicaSet, with the same rolling update strategy. Finally, you'll have 3 available replicas in the new ReplicaSet, and the old ReplicaSet is scaled down to 0.

  • Press Ctrl-C to stop the above rollout status watch. For more information on stuck rollouts, read more herearrow-up-right.

  • You see that the number of old replicas (nginx-deployment-1564180365 and nginx-deployment-2035384211) is 2, and new replicas (nginx-deployment-3066724191) is 1.

    The output is similar to this:

  • Looking at the Pods created, you see that 1 Pod created by new ReplicaSet is stuck in an image pull loop.

    The output is similar to this:

    Note: The Deployment controller stops the bad rollout automatically, and stops scaling up the new ReplicaSet. This depends on the rollingUpdate parameters (maxUnavailable specifically) that you have specified. Kubernetes by default sets the value to 25%.

  • Get the description of the Deployment:

    The output is similar to this:

    To fix this, you need to rollback to a previous revision of Deployment that is stable.

  • Annotating the Deployment with kubectl annotate deployment/nginx-deployment kubernetes.io/change-cause="image updated to 1.16.1"
  • Manually editing the manifest of the resource.

  • To see the details of each revision, run:

    The output is similar to this:

  • The Deployment is now rolled back to a previous stable revision. As you can see, a DeploymentRollback event for rolling back to revision 2 is generated from Deployment controller.
  • Check if the rollback was successful and the Deployment is running as expected, run:

    The output is similar to this:

  • Get the description of the Deployment:

    The output is similar to this:

  • The image update starts a new rollout with ReplicaSet nginx-deployment-1989198191, but it's blocked due to the maxUnavailable requirement that you mentioned above. Check out the rollout status:

    The output is similar to this:

  • Then a new scaling request for the Deployment comes along. The autoscaler increments the Deployment replicas to 15. The Deployment controller needs to decide where to add these new 5 replicas. If you weren't using proportional scaling, all 5 of them would be added in the new ReplicaSet. With proportional scaling, you spread the additional replicas across all ReplicaSets. Bigger proportions go to the ReplicaSets with the most replicas and lower proportions go to ReplicaSets with less replicas. Any leftovers are added to the ReplicaSet with the most replicas. ReplicaSets with zero replicas are not scaled up.

  • Pause by running the following command:

    The output is similar to this:

  • Then update the image of the Deployment:

    The output is similar to this:

  • Notice that no new rollout started:

    The output is similar to this:

  • Get the rollout status to verify that the existing ReplicaSet has not changed:

    The output is similar to this:

  • You can make as many updates as you wish, for example, update the resources that will be used:

    The output is similar to this:

    The initial state of the Deployment prior to pausing its rollout will continue its function, but new updates to the Deployment will not have any effect as long as the Deployment rollout is paused.

  • Eventually, resume the Deployment rollout and observe a new ReplicaSet coming up with all the new updates:

    The output is similar to this:

  • Watch the status of the rollout until it's done.

    The output is similar to this:

  • Get the status of the latest rollout:

    The output is similar to this:

  • New Pods become ready or available (ready for at least MinReadySecondsarrow-up-right).
    |
    reason: ReplicaSetUpdated
    Insufficient permissions
  • Limit ranges

  • Application runtime misconfiguration

  • Ordered, automated rolling updates.
    StatefulSets currently require a Headless Servicearrow-up-right to be responsible for the network identity of the Pods. You are responsible for creating this Service.
  • StatefulSets do not provide any guarantees on the termination of pods when a StatefulSet is deleted. To achieve ordered and graceful termination of the pods in the StatefulSet, it is possible to scale the StatefulSet down to 0 prior to deletion.

  • When using Rolling Updatesarrow-up-right with the default Pod Management Policyarrow-up-right (OrderedReady), it's possible to get into a broken state that requires manual intervention to repairarrow-up-right.

  • will provide stable storage using
    provisioned by a PersistentVolume Provisioner.

    foo/web

    nginx.foo.svc.cluster.local

    web-{0..N-1}.nginx.foo.svc.cluster.local

    web-{0..N-1}

    kube.local

    foo/nginx

    foo/web

    nginx.foo.svc.kube.local

    web-{0..N-1}.nginx.foo.svc.kube.local

    web-{0..N-1}

    Before a Pod is terminated, all of its successors must be completely shutdown.

    NoSchedule

    DaemonSet Pods can be scheduled onto nodes with memory pressure issues.

    NoSchedule

    DaemonSet Pods can be scheduled onto nodes with process pressure issues.

    NoSchedule

    DaemonSet Pods can be scheduled onto nodes that are unschedulable.

    NoSchedule

    Only added for DaemonSet Pods that request host networking, i.e., Pods having spec.hostNetwork: true. Such DaemonSet Pods can be scheduled onto nodes with unavailable network.

    DNS
    : Create a
    with the same pod selector, and then discover DaemonSets using the endpoints resource or retrieve multiple A records from DNS.
  • Service: Create a service with the same Pod selector, and use the service to reach a daemon on a random node. (No way to reach specific node.)

  • Parallel Jobs with a fixed completion count:

    • specify a non-zero positive value for .spec.completions.

    • the Job represents the overall task, and is complete when there are .spec.completions successful Pods.

    • when using .spec.completionMode="Indexed", each Pod gets a different index in the range 0 to .spec.completions-1.

  • Parallel Jobs with a work queue:

    • do not specify .spec.completions, default to .spec.parallelism.

    • the Pods must coordinate amongst themselves or an external service to determine what each should work on. For example, a Pod might fetch a batch of up to N items from the work queue.

    • each Pod is independently capable of determining whether or not all its peers are done, and thus that the entire Job is done.

    • when any Pod from the Job terminates with success, no new Pods are created.

    • once at least one Pod has terminated with success and all Pods are terminated, then the Job is completed with success.

    • once any Pod has exited with success, no other Pod should still be doing any work for this task or writing any output. They should all be in the process of exiting.

  • If the Job
    has not had time to react.
  • If the Job controller failed to create Pods for any reason (lack of ResourceQuota, lack of permission, etc.), then there may be fewer pods than requested.

  • The Job controller may throttle new Pod creation due to excessive previous pod failures in the same Job.

  • When a Pod is gracefully shut down, it takes time to stop.

  • . The index is available through three mechanisms:
    • The Pod annotation batch.kubernetes.io/job-completion-index.

    • As part of the Pod hostname, following the pattern $(job-name)-$(index). When you use an Indexed Job in combination with a Servicearrow-up-right, Pods within the Job can use the deterministic hostnames to address each other via DNS. For more information about how to configure this, see Job with Pod-to-Pod Communicationarrow-up-right.

    • From the containerized task, in the environment variable JOB_COMPLETION_INDEX.

    The Job is considered complete when there is one successfully completed Pod for each index. For more information about how to use this mode, see Indexed Job for Parallel Processing with Static Work Assignmentarrow-up-right.

    is reached the
    entire Job
    failed.

    you may want to restrict a rule to a specific container by specifying its name inspec.podFailurePolicy.rules[*].containerName. When not specified the rule applies to all containers. When specified, it should match one the container or initContainer names in the Pod template.

  • you may specify the action taken when a Pod failure policy is matched by spec.podFailurePolicy.rules[*].action. Possible values are:

    • FailJob: use to indicate that the Pod's job should be marked as Failed and all running Pods should be terminated.

    • Ignore: use to indicate that the counter towards the .spec.backoffLimit should not be incremented and a replacement Pod should be created.

    • Count: use to indicate that the Pod should be handled in the default way. The counter towards the .spec.backoffLimit should be incremented.

  • ✓

    ✓

    ✓

    ✓

    sometimes

    sometimes

    should be 1

    W

    W

    cluster.local

    default/nginx

    default/web

    nginx.default.svc.cluster.local

    web-{0..N-1}.nginx.default.svc.cluster.local

    web-{0..N-1}

    cluster.local

    node.kubernetes.io/not-readyarrow-up-right

    NoExecute

    DaemonSet Pods can be scheduled onto nodes that are not healthy or ready to accept Pods. Any DaemonSet Pods running on such nodes will not be evicted.

    node.kubernetes.io/unreachablearrow-up-right

    NoExecute

    DaemonSet Pods can be scheduled onto nodes that are unreachable from the node controller. Any DaemonSet Pods running on such nodes will not be evicted.

    node.kubernetes.io/disk-pressurearrow-up-right

    NoSchedule

    DaemonSet Pods can be scheduled onto nodes with disk pressure issues.

    Queue with Pod Per Work Itemarrow-up-right

    ✓

    sometimes

    Queue with Variable Pod Countarrow-up-right

    ✓

    ✓

    Pattern

    .spec.completions

    .spec.parallelism

    Queue with Pod Per Work Itemarrow-up-right

    W

    any

    Queue with Variable Pod Countarrow-up-right

    null

    any

    Indexed Job with Static Work Assignmentarrow-up-right

    W

    any

    Job Template Expansionarrow-up-right

    CronJobarrow-up-right
    ReplicationControllerarrow-up-right
    metadata.ownerReferencesarrow-up-right
    Controllerarrow-up-right
    controllers/frontend.yamlarrow-up-right
    pods/pod-rs.yamlarrow-up-right
    DNS subdomainarrow-up-right
    DNS labelarrow-up-right
    .spec sectionarrow-up-right
    pod templatearrow-up-right
    restart policyarrow-up-right
    label selectorarrow-up-right
    earlierarrow-up-right
    kubectl deletearrow-up-right
    Garbage collectorarrow-up-right
    kubectl deletearrow-up-right
    Deploymentarrow-up-right
    controller.kubernetes.io/pod-deletion-costarrow-up-right
    feature gatearrow-up-right
    Horizontal Pod Autoscalers (HPA)arrow-up-right
    controllers/hpa-rs.yamlarrow-up-right
    Deploymentarrow-up-right
    ReplicaSetarrow-up-right
    controllers/replication.yamlarrow-up-right
    DNS subdomainarrow-up-right
    DNS labelarrow-up-right
    object managementarrow-up-right
    .spec sectionarrow-up-right
    pod templatearrow-up-right
    Podarrow-up-right
    pod selectorarrow-up-right
    .spec.template.spec.restartPolicyarrow-up-right
    Kubeletarrow-up-right
    label selectorarrow-up-right
    belowarrow-up-right
    kubectl deletearrow-up-right
    client libraryarrow-up-right
    kubectl deletearrow-up-right
    client libraryarrow-up-right
    rolling updatearrow-up-right
    #1353arrow-up-right
    RabbitMQ work queuesarrow-up-right
    readinessarrow-up-right
    #492arrow-up-right
    spreadingarrow-up-right
    #170arrow-up-right
    Asgardarrow-up-right
    Podsarrow-up-right
    ReplicaSetsarrow-up-right
    Controllerarrow-up-right
    Create a Deployment to rollout a ReplicaSetarrow-up-right
    Declare the new state of the Podsarrow-up-right
    Rollback to an earlier Deployment revisionarrow-up-right
    environment variablearrow-up-right
    controllers/nginx-deployment.yamlarrow-up-right
    Writing a Deployment Specarrow-up-right
    kubectl rolloutarrow-up-right
    horizontal Pod autoscalingarrow-up-right
    maxSurgearrow-up-right
    maxUnavailablearrow-up-right
    progressingarrow-up-right
    completearrow-up-right
    fail to progressarrow-up-right
    .spec.progressDeadlineSecondsarrow-up-right
    Kubernetes API conventionsarrow-up-right
    managing resourcesarrow-up-right
    deploying applicationsarrow-up-right
    using kubectl to manage resourcesarrow-up-right
    DNS subdomainarrow-up-right
    DNS labelarrow-up-right
    .spec sectionarrow-up-right
    Pod templatearrow-up-right
    Podarrow-up-right
    selectorarrow-up-right
    .spec.template.spec.restartPolicyarrow-up-right
    HorizontalPodAutoscalerarrow-up-right
    control planearrow-up-right
    label selectorarrow-up-right
    StatefulSetarrow-up-right
    failed progressingarrow-up-right
    Container Probesarrow-up-right
    Podsarrow-up-right
    Deploymentarrow-up-right
    Deploymentarrow-up-right
    ReplicaSetarrow-up-right
    PersistentVolume Provisionerarrow-up-right
    DNS labelarrow-up-right
    PersistentVolumesarrow-up-right
    Rolling Updatearrow-up-right
    Container Probesarrow-up-right
    replicasarrow-up-right
    feature gatearrow-up-right
    Headless Servicearrow-up-right
    limitationsarrow-up-right
    Headless Servicearrow-up-right
    otherwise configuredarrow-up-right
    controllerarrow-up-right
    force deleting StatefulSet Podsarrow-up-right
    Running and Readyarrow-up-right
    abovearrow-up-right
    Minimum Ready Secondsarrow-up-right
    feature gatearrow-up-right
    Rolling Updatesarrow-up-right
    Pod Management Policyarrow-up-right
    known issuearrow-up-right
    feature gatearrow-up-right
    controllerarrow-up-right
    owner referencesarrow-up-right
    garbage collectorarrow-up-right
    HorizontalPodAutoscalerarrow-up-right
    control planearrow-up-right
    controllers/daemonset.yamlarrow-up-right
    running stateless applicationsarrow-up-right
    object management using kubectlarrow-up-right
    DNS subdomain namearrow-up-right
    .specarrow-up-right
    pod templatearrow-up-right
    Podarrow-up-right
    pod selectorarrow-up-right
    RestartPolicyarrow-up-right
    Jobarrow-up-right
    ReplicationControllerarrow-up-right
    node selectorarrow-up-right
    node affinityarrow-up-right
    priorityarrow-up-right
    tolerationsarrow-up-right
    cluster networkingarrow-up-right
    perform a rolling updatearrow-up-right
    CronJobarrow-up-right
    controllers/job.yamlarrow-up-right
    kubectl describe job piarrow-up-right
    kubectl get job pi -o yamlarrow-up-right
    DNS subdomainarrow-up-right
    DNS labelarrow-up-right
    .spec sectionarrow-up-right
    pod templatearrow-up-right
    Podarrow-up-right
    pod selectorarrow-up-right
    RestartPolicyarrow-up-right
    specifying your own pod selectorarrow-up-right
    job patternsarrow-up-right
    pod lifecyclearrow-up-right
    pod backoff failure policyarrow-up-right
    pod failure policyarrow-up-right
    feature gatesarrow-up-right
    feature gatearrow-up-right
    Pod disruption conditionsarrow-up-right
    Pod backoff failure policyarrow-up-right
    preemptionarrow-up-right
    API-initiated evictionarrow-up-right
    taintarrow-up-right
    /controllers/job-pod-failure-policy-example.yamlarrow-up-right
    tracking finalizerarrow-up-right
    Pod Phasearrow-up-right
    usuallyarrow-up-right
    Pod template specarrow-up-right
    CronJobsarrow-up-right
    TTL controllerarrow-up-right
    control planearrow-up-right
    garbage collectsarrow-up-right
    LimitRangesarrow-up-right
    ResourceQuotasarrow-up-right
    specarrow-up-right
    terminatedarrow-up-right
    suspendarrow-up-right
    scheduling gatesarrow-up-right
    controllerarrow-up-right
    feature gatearrow-up-right
    API serverarrow-up-right

    foo/nginx

    1

    PersistentVolumesarrow-up-right
    headless servicearrow-up-right
    Controllerarrow-up-right
    NAT is not required: Pods on a node should be able to communicate with all Pods on all nodes without NAT.
  • Agents get all-access passes: Agents on a node (system daemons, Kubelet) can communicate with all the Pods in that node.

  • Shared namespaces: Containers within a Pod share a network namespace (IP and MAC address), so they can communicate with each other using the loopback address.

  • hashtag
    What Kubernetes networking solves

    Kubernetes networking is designed to ensure that the different entity types within Kubernetes can communicate. The layout of a Kubernetes infrastructure has, by design, a lot of separation. Namespaces, containers, and Pods are meant to keep components distinct from one another, so a highly structured plan for communication is important.

    (Nived Velayudhan, CC BY-SA 4.0)

    hashtag
    Container-to-container networking

    Container-to-container networking happens through the Pod network namespace. Network namespaces allow you to have separate network interfaces and routing tables that are isolated from the rest of the system and operate independently. Every Pod has its own network namespace, and containers inside that Pod share the same IP address and ports. All communication between these containers happens through localhost, as they are all part of the same namespace. (Represented by the green line in the diagram.)

    hashtag
    Pod-to-Pod networking

    With Kubernetes, every node has a designated CIDR range of IPs for Pods. This ensures that every Pod receives a unique IP address that other Pods in the cluster can see. When a new Pod is created, the IP addresses never overlap. Unlike container-to-container networking, Pod-to-Pod communication happens using real IPs, whether you deploy the Pod on the same node or a different node in the cluster.

    The diagram shows that for Pods to communicate with each other, the traffic must flow between the Pod network namespace and the Root network namespace. This is achieved by connecting both the Pod namespace and the Root namespace by a virtual ethernet device or a veth pair (veth0 to Pod namespace 1 and veth1 to Pod namespace 2 in the diagram). A virtual network bridge connects these virtual interfaces, allowing traffic to flow between them using the Address Resolution Protocol (ARP).

    When data is sent from Pod 1 to Pod 2, the flow of events is:

    1. Pod 1 traffic flows through eth0 to the Root network namespace's virtual interface veth0.

    2. Traffic then goes through veth0 to the virtual bridge, which is connected to veth1.

    3. Traffic goes through the virtual bridge to veth1.

    4. Finally, traffic reaches the eth0 interface of Pod 2 through veth1.

    hashtag
    Pod-to-Service networking

    Pods are very dynamic. They may need to scale up or down based on demand. They may be created again in case of an application crash or a node failure. These events cause a Pod's IP address to change, which would make networking a challenge.

    Credit to : (Nived Velayudhan, CC BY-SA 4.0)

    Kubernetes solves this problem by using the Service function, which does the following:

    1. Assigns a static virtual IP address in the frontend to connect any backend Pods associated with the Service.

    2. Load-balances any traffic addressed to this virtual IP to the set of backend Pods.

    3. Keeps track of the IP address of a Pod, such that even if the Pod IP address changes, the clients don't have any trouble connecting to the Pod because they only directly connect with the static virtual IP address of the Service itself.

    The in-cluster load balancing occurs in two ways:

    1. IPTABLES: In this mode, kube-proxy watches for changes in the API Server. For each new Service, it installs iptables rules, which capture traffic to the Service's clusterIP and port, then redirects traffic to the backend Pod for the Service. The Pod is selected randomly. This mode is reliable and has a lower system overhead because Linux Netfilter handles traffic without the need to switch between userspace and kernel space.

    2. IPVS: IPVS is built on top of Netfilter and implements transport-layer load balancing. IPVS uses the Netfilter hook function, using the hash table as the underlying data structure, and works in the kernel space. This means that kube-proxy in IPVS mode redirects traffic with lower latency, higher throughput, and better performance than kube-proxy in iptables mode.

    The diagram above shows the package flow from Pod 1 to Pod 3 through a Service to a different node (marked in red). The package traveling to the virtual bridge would have to use the default route (eth0) as ARP running on the bridge wouldn't understand the Service. Later, the packages have to be filtered by iptables, which uses the rules defined in the node by kube-proxy. Therefore the diagram shows the path as it is.

    hashtag
    Internet-to-Service networking

    So far, I have discussed how traffic is routed within a cluster. There's another side to Kubernetes networking, though, and that's exposing an application to the external network.

    (Nived Velayudhan, CC BY-SA 4.0)

    You can expose an application to an external network in two different ways.

    1. Egress: Use this when you want to route traffic from your Kubernetes Service out to the Internet. In this case, iptables performs the source NAT, so the traffic appears to be coming from the node and not the Pod.

    2. Ingress: This is the incoming traffic from the external world to Services. Ingress also allows and blocks particular communications with Services using rules for connections. Typically, there are two ingress solutions that function on different network stack regions: the service load balancer and the ingress controller.

    hashtag
    Discovering Services

    There are two ways Kubernetes discovers a Service:

    1. Environment Variables: The kubelet service running on the node where your Pod runs is responsible for setting up environment variables for each active service in the format {SVCNAME}_SERVICE_HOST and {SVCNAME}_SERVICE_PORT. You must create the Service before the client Pods come into existence. Otherwise, those client Pods won't have their environment variables populated.

    2. DNS: The DNS service is implemented as a Kubernetes service that maps to one or more DNS server Pods, which are scheduled just like any other Pod. Pods in the cluster are configured to use the DNS service, with a DNS search list that includes the Pod's own namespace and the cluster's default domain. A cluster-aware DNS server, such as CoreDNS, watches the Kubernetes API for new Services and creates a set of DNS records for each one. If DNS is enabled throughout your cluster, all Pods can automatically resolve Services by their DNS name. The Kubernetes DNS server is the only way to access ExternalName Services.

    hashtag
    ServiceTypes for publishing Services:

    Kubernetes Services provide you with a way of accessing a group of Pods, usually defined by using a label selector. This could be applications trying to access other applications within the cluster, or it could allow you to expose an application running in the cluster to the external world. Kubernetes ServiceTypes enable you to specify what kind of Service you want.

    (Ahmet Alp Balkan, CC BY-SA 4.0)

    The different ServiceTypes are:

    1. ClusterIP: This is the default ServiceType. It makes the Service only reachable from within the cluster and allows applications within the cluster to communicate with each other. There is no external access.

    2. LoadBalancer: This ServiceType exposes the Services externally using the cloud provider's load balancer. Traffic from the external load balancer is directed to the backend Pods. The cloud provider decides how it is load-balanced.

    3. NodePort: This allows the external traffic to access the Service by opening a specific port on all the nodes. Any traffic sent to this Port is then forwarded to the Service.

    4. ExternalName: This type of Service maps a Service to a DNS name by using the contents of the externalName field by returning a CNAME record with its value. No proxying of any kind is set up.

    hashtag
    Cluster Networking ^arrow-up-right

    In a standard Kubernetes deployment, there are several networking variations you should be aware of. Below are the most common networking situations to know.

    Also read: Docker vs Virtual Machinearrow-up-right to understand what is their difference.

    hashtag
    Container-to-container Networking

    The smallest object we can deploy in Kubernetes is the pod, however, within each pod, you may want to run multiple containersarrow-up-right. A common use-case for this is a helper where a secondary container helps a primary container with tasks such as pushing and pulling data. Container to container communication within a K8s pod uses either the shared file system or the localhost network interface.

    hashtag
    Pod-to-Pod Networking

    Pod-to-pod networking can occur for pods within the same node or across nodes. Each of your nodes has a classless inter-domain routing (CIDR) block. This block is a defined set of unique IP addresses that are assigned to pods within that node. This ensures that each pod is provided with a unique IP regardless of which node it is in.

    There are 2 types of communication.

    • Inter-node communication

    • Intra-node communication

    Also Check: our previous blog on helm Kubernetesarrow-up-right

    hashtag
    Pod-to-Service Networking

    Kubernetes is designed to allow pods to be replaced dynamically, as needed. This means that pod IP addresses are not durable unless special precautions are taken, such as for stateful applications. To address this issue and ensure that communication with and between pods is maintained, Kubernetes uses services.

    Kubernetes services manage pod states and enable you to track pod IP addresses over time. These services abstract pod addresses by assigning a single virtual IP (a cluster IP) to a group of pod IPs. Then, any traffic sent to the virtual IP is distributed to the associated pods.

    This service IP enables pods to be created and destroyed as needed without affecting overall communications. It also enables Kubernetes services to act as in-cluster load balancers, distributing traffic as needed among associated pods.

    hashtag
    Internet-to-Service Networking

    The final networking situation that is needed for most deployments is between the Internet and services. Whether you are using Kubernetes for internal or external applications, you generally need Internet connectivity. This connectivity enables users to access your services and distributed teams to collaborate.

    When setting up external access, there are two techniques you need to use — egress and ingress. These are policies that you can set up with either whitelisting or blacklisting to control traffic into and out of your network.

    Also Read: Our blog post on Kubernetes delete deploymentarrow-up-right. Click here

    hashtag
    What are Services in Kubernetes? ^arrow-up-right

    Kubernetes Service provides the IP Address, a single DNS name, and a Load Balancer to a set of Pods. A Service identifies its member Pods with a selector. For a Pod to be a member of the Service, the Pod must have all of the labels specified in the selector. A label is an arbitrary key/value pair that is attached to an object. K8s Services are also a REST object and also an abstraction that defines a logical set of pods and a policy for accessing the pod set.

    Services select Pods based on their labels. When a network request is made to the service, it selects all Pods in the cluster matching the service’s selector, chooses one of them, and forwards the network request to it. Let us look at the core attributes of any kind of service in Kubernetes:

    • Label selector that locates pods

    • ClusterIP IP address & assigned port number

    • Port definitions

    • Optional mapping of incoming ports to a targetPort

    Check Out: Kubernetes Monitoring Toolsarrow-up-right. Click here

    hashtag
    ClusterIP

    ClusterIP is the default Service type in Kubernetes. In this Service, Kubernetes creates a stable IP Address that is accessible from all the nodes in the cluster. The scope of this service is confined within the cluster only. The main use case of this service is to connect our Frontend Pods to our Backend Pods as we don’t expose backend Pods to the outside world because of security reasons.

    hashtag
    NodePort

    NodePort exposes the Service on each Node’s IP at a static port (the NodePort). NodePort builds on top of ClusterIP to create a mapping from each Worker Node’s static IP on a specified (or Kubernetes has chosen) Port. We can contact the NodePort service, from outside the cluster, by requesting <Node IP>:<Nodeport>. The only main use case of NodePort Service is to expose our Pods to the outside world. Note: We can only expose the ports 30000-32767.

    hashtag
    LoadBalancer

    The LoadBalancer Service is a standard way for exposing our Nodes to the outside world or the internet. We have multiple Pods deployed on multiple Nodes, to access our application we can use any of the Public IP of any node and node port. But there are some problems in this scenario, like which Nodes IP we will provide to the clients and how will the traffic balance between the multiple nodes into the cluster. A simple solution for this will be LoadBalancer.

    Also Read: Kubernetes Labelsarrow-up-right and Kubernetes Annotations are one of the main components which provide a way for adding additional metadata to our Kubernetes Objects.

    hashtag
    Ingress Controller

    Ingress Controller is an intelligent Load Balancer. Ingress is a high-level abstraction responsible for allowing simple host or URL based HTTP routing. It is always implemented using a third-party proxy. These implementations are nothing but Ingress Controller. It is a Layer-7 load balancer.

    Ingress Architecture

    Also Read: Know everything about Ingress Controllerarrow-up-right.

    hashtag
    DNS in Kubernetes ^arrow-up-right

    The Domain Name System (DNS) is the networking system in place that allows us to resolve human-friendly names to unique IP addresses. By default, most Kubernetes clusters automatically configure an internal DNS service to provide a lightweight mechanism for service discovery. Kube-DNS and CoreDNS are two established DNS solutions for defining DNS naming rules and resolving pod and service DNS to their corresponding cluster IPs. With DNS, Kubernetes services can be referenced by name that will correspond to any number of backend pods managed by the service.

    A DNS Pod consists of three separate containers:

    • Kubedns: watches the Kubernetes master for changes in Services and Endpoints, and maintains in-memory lookup structures to serve DNS requests.

    • Dnsmasq: adds DNS caching to improve performance.

    • Sidecar: provides a single health check endpoint to perform health checks for dnsmasq and kubedns.

    hashtag
    Lab 1 : Create ingress route to Nignx deployment

    hashtag
    Lab 2 : Create ingress route to Wordpress deployment

    There are two ways of creating a config map:

    i) The imperative way – without using a ConfigMap definition file ii) Declarative way by using a Configmap definition file.

    hashtag
    Create a ConfigMap

    ConfigMap can be written manually as a YAML representation and load it into Kubernetes, or you can also apply the kubectl create configmap command to create it from the CLI.

    Create a ConfigMap Using kubectl

    Run the kubectl create configmap cmd to create ConfigMaps from directories, files, or literal values:

    Where <map-name> is the name you want for ConfigMap and <data-source> is the directory, file, or literal value to draw the data from.

    Check Out: How to launch Kubernetes dashboardarrow-up-right. Click here

    hashtag
    ConfigMaps and Pods

    You can write a Pod spec that attributes to a ConfigMap and configures the container based on the data in the ConfigMap. Note that the Pod and the ConfigMap must exist in the same namespace.

    Let’s look at an instance now, ConfigMap, with some keys with single values and other keys where the value looks like a fragment of a configuration format.

    There are four various ways you can use a ConfigMap to configure a container in a Pod:

    1. Entrypoint of the containers via command line.

    2. Environment variables for a container.

    3. Also, we can add a file in read-only volume for the application to read.

    4. Manually written Code to run inside the Pod that uses the K8s API to read a ConfigMap.

    Also Read: Our previous blog post on Kubernetes deploymentarrow-up-right. Click here

    hashtag
    Using ConfigMaps

    ConfigMaps can be mounted as data volumes. Other parts of the system can also use ConfigMaps without being directly exposed to the Pod. For example, ConfigMaps can hold data that different system parts should use for configuration. The usual way of using ConfigMaps is to configure environments for containers running in a Pod in the same namespace. You can also use ConfigMap separately.

    Check Out: Kubernetes Operator Examplearrow-up-right. Click here

    hashtag
    Immutable ConfigMaps

    The K8s beta feature Immutable Secrets and ConfigMaps gives an option to set specific Secrets and ConfigMaps as immutable. And for clusters that extensively use ConfigMaps, restricting modifications to their data has the following advantages:

    • Protects you from accidental updates that could cause applications outages

    • Improves the performance of your cluster by significantly reducing the load on the Kube-API server by closing watches for ConfigMaps marked as immutable.

    The Immutable Ephemeral Volumes control this feature gate. You can build an immutable ConfigMap by fixing the immutable field to true. For example:

    Also Read: Our blog post on Docker and Kubernetesarrow-up-right. Click here

    hashtag
    Kubernetes Secrets

    Kubernetes Secrets

    Secrets 🔐 are used to hold sensitive data like passwords or keys. They’re similar to configMap except that they’re stored in an encoded or hashed format with config maps.

    There are two levels involved in working with secrets. First, to create the secret, and second, to introduce it into the pod. Putting confidential data in secret is safer and adaptable rather than putting it in a container image or a Pod definition.

    To use a secret, a pod has to reference the secret. There are three ways to use a secret with a Pod:

    • As a file in a volume mounted on one or more of its containers.

    • As a container environment variable.

    • kubelet uses secrets by pulling images for the Pod.

    hashtag
    Built-in Secrets

    Built-in Secrets is where Service accounts automatically create and Attach Secrets with API credentials. K8s automatically creates secrets that include credentials for reaching the API and automatically alters your pods to use this type of secret. The automatic and also the use of API credentials can be overridden or disabled if wanted.

    hashtag
    Creating a Secret

    There are several options to create a Secret:

    • Create Secret using kubectl command

    • We can create a Secret from the config file

    • Create Secret using customise

    hashtag
    Editing a Secret

    Run the following command to edit a Secret:

    hashtag
    Using Secrets

    Secrets can be attached as data volumes or exhibited as environment variables used by a container in a Pod. Other parts of the system can also use secrets without being directly exposed to the Pod.

    Also Read: Our previous blog post on Kubernetes labelsarrow-up-right. Click here

    hashtag
    Updating Secrets and ConfigMaps

    Secrets and ConfigMaps

    Kubernetes manages our environment variables, which means we don’t have to change code or rebuild containers when changing the variable’s value. The updation is a two-step process because pods cache the value of environment variables during startup.

    First, update the values:

    Then, restart the pods. This can be done in various ways, such as forcing a new deployment. The quick and easy way is to delete the pods manually and have the deployment automatically spin up new ones.

    It is most suitable to create your Secrets and ConfigMaps using the above method so kubectl can record its annotation for tracking changes to the resource in the spec. Another way of doing this is using the –save-config command-line option when running kubectl create secret|configmap.

    configmap

    AWS SNS

    hashtag
    What is SNS?

    • SNS stands for Simple Notification Service.

    • It is a web service which makes it easy to set up, operate, and send a notification from the cloud.

    • It provides developers with the highly scalable, cost-effective, and flexible capability to publish messages from an application and sends them to other applications.

    • It is a way of sending messages. When you are using AutoScaling, it triggers an SNS service which will email you that "your EC2 instance is growing".

    • SNS can also send the messages to devices by sending push notifications to Apple, Google, Fire OS, and Windows devices, as well as Android devices in China with Baidu Cloud Push.

    • Besides sending the push notifications to the mobile devices, Amazon SNS sends the notifications through SMS or email to an Amazon Simple Queue Service (SQS), or to an HTTP endpoint.

    • SNS notifications can also trigger the Lambda function. When a message is published to an SNS topic that has a Lambda function associated with it, Lambda function is invoked with the payload of the message. Therefore, we can say that the Lambda function is invoked with a message payload as an input parameter and manipulate the information in the message and then sends the message to other SNS topics or other AWS services.

    • Amazon SNS allows you to group multiple recipients using topics where the topic is a logical access point that sends the identical copies of the same message to the subscribe recipients.

    • Amazon SNS supports multiple endpoint types. For example, you can group together IOS, Android and SMS recipients. Once you publish the message to the topic, SNS delivers the formatted copies of your message to the subscribers.

    • To prevent the loss of data, all messages published to SNS are stored redundantly across multiple availability zones.

    hashtag
    SNS Publishers and Subscribers

    Amazon SNS is a web service that manages sending messages to the subscribing endpoint. There are two clients of SNS:

    • Subscribers

    • Publishers

    Publishers

    Publishers are also known as producers that produce and send the message to the SNS which is a logical access point.

    Subscribers

    Subscribers such as web servers, email addresses, Amazon SQS queues, AWS Lambda functions receive the message or notification from the SNS over one of the supported protocols (Amazon SQS, email, Lambda, HTTP, SMS).

    Note: A publisher sends the message to the SNS topic that they have created. There is no need to specify the destination address while publishing the message as the topic itself matches the subscribers associated with the topic that the publisher has created and delivers the message to the subscribers.

    hashtag
    How to use SNS

    • Move to the SNS service available under the application services.

    • Click on the Topics appearing on the left side of the Console.

    • Click on the Create Topic to create a new topic.

    • Enter the topic name in a text box.

    • The below screen shows that the topic has been created successfully.

    • To create a subscription, click on the Create subscription.

    • Now, choose the endpoint type and enter the Endpoint address, i.e., where you want to send your notification.

    • The below screen shows that the status of subscription is pending.

    • The below screen shows that mail has been sent to the subscriber. A Subscriber has to click on the Confirm Subscription.

    • Click on the topic name, i.e., hello and then click on the Publish message.

    • Enter the subject, Time to Live and Message body to send to the endpoint.

    • The message has been sent to all the subscribers that have been mentioned in the ID.

    hashtag
    Benefits of SNS

    • Instantaneous delivery SNS is based on push-based delivery. This is the key difference between SNS and SQS. SNS is pushed once you publish the message in a topic and the message is delivered to multiple subscribers.

    • Flexible SNS supports multiple endpoint types. Multiple endpoint types can receive the message over multiple transport protocols such as email, SMS, Lambda, Amazon SQS, HTTP, etc.

    • Inexpensive SNS service is quite inexpensive as it is based on pay-as-you-go model, i.e., you need to pay only when you are using the resources with no up-front costs.

    hashtag
    Differences b/w SNS and SQS

    • SNS stands for Simple Notification Service while SQS stands for Simple Queue Service.

    • SQS is a pull-based delivery, i.e., messages are not pushed to the receivers. Users have to pull the messages from the Queue. SNS is a push-based delivery, i.e., messages are pushed to multiple subscribers.

    • In SNS service, messages are pushed to the multiple receivers at the same time while in SQS service, messages are not received by the multiple receivers at the same time.

    Kubernetes Session 2

    hashtag
    What is a Kubernetes Namespace?

    A namespace helps separate a cluster into logical units. It helps granularly organize, allocate, manage, and secure cluster resources. Here are two notable use cases for Kubernetes namespaces:

    • Apply policies to cluster segments

    Application Deployment pricing

    circle-info

    Monthly cost : pay for OVH fixed and pay as you go for AWS

    ID
    Cloud Provider

    kubernetea Labs

    hashtag
    Lab 1 : Replicaset lab

    hashtag
    Lab 2 : Create Statfulset for mySQl DB with PVC and Secret

    Waiting for rollout to finish: 2 out of 3 new replicas have been updated...
    deployment "nginx-deployment" successfully rolled out
    NAME               READY   UP-TO-DATE   AVAILABLE   AGE
    nginx-deployment   3/3     3            3           18s
    NAME                          DESIRED   CURRENT   READY   AGE
    nginx-deployment-75675f5897   3         3         3       18s
    NAME                                READY     STATUS    RESTARTS   AGE       LABELS
    nginx-deployment-75675f5897-7ci7o   1/1       Running   0          18s       app=nginx,pod-template-hash=75675f5897
    nginx-deployment-75675f5897-kzszj   1/1       Running   0          18s       app=nginx,pod-template-hash=75675f5897
    nginx-deployment-75675f5897-qqcnn   1/1       Running   0          18s       app=nginx,pod-template-hash=75675f5897
    kubectl rollout status deployment/nginx-deployment
    Waiting for rollout to finish: 2 out of 3 new replicas have been updated...
    deployment "nginx-deployment" successfully rolled out
    kubectl get pods
    NAME                                READY     STATUS    RESTARTS   AGE
    nginx-deployment-1564180365-khku8   1/1       Running   0          14s
    nginx-deployment-1564180365-nacti   1/1       Running   0          14s
    nginx-deployment-1564180365-z9gth   1/1       Running   0          14s
    kubectl describe deployments
    Name:                   nginx-deployment
    Namespace:              default
    CreationTimestamp:      Thu, 30 Nov 2017 10:56:25 +0000
    Labels:                 app=nginx
    Annotations:            deployment.kubernetes.io/revision=2
    Selector:               app=nginx
    Replicas:               3 desired | 3 updated | 3 total | 3 available | 0 unavailable
    StrategyType:           RollingUpdate
    MinReadySeconds:        0
    RollingUpdateStrategy:  25% max unavailable, 25% max surge
    Pod Template:
      Labels:  app=nginx
       Containers:
        nginx:
          Image:        nginx:1.16.1
          Port:         80/TCP
          Environment:  <none>
          Mounts:       <none>
        Volumes:        <none>
      Conditions:
        Type           Status  Reason
        ----           ------  ------
        Available      True    MinimumReplicasAvailable
        Progressing    True    NewReplicaSetAvailable
      OldReplicaSets:  <none>
      NewReplicaSet:   nginx-deployment-1564180365 (3/3 replicas created)
      Events:
        Type    Reason             Age   From                   Message
        ----    ------             ----  ----                   -------
        Normal  ScalingReplicaSet  2m    deployment-controller  Scaled up replica set nginx-deployment-2035384211 to 3
        Normal  ScalingReplicaSet  24s   deployment-controller  Scaled up replica set nginx-deployment-1564180365 to 1
        Normal  ScalingReplicaSet  22s   deployment-controller  Scaled down replica set nginx-deployment-2035384211 to 2
        Normal  ScalingReplicaSet  22s   deployment-controller  Scaled up replica set nginx-deployment-1564180365 to 2
        Normal  ScalingReplicaSet  19s   deployment-controller  Scaled down replica set nginx-deployment-2035384211 to 1
        Normal  ScalingReplicaSet  19s   deployment-controller  Scaled up replica set nginx-deployment-1564180365 to 3
        Normal  ScalingReplicaSet  14s   deployment-controller  Scaled down replica set nginx-deployment-2035384211 to 0
    kubectl get rs
    NAME                          DESIRED   CURRENT   READY   AGE
    nginx-deployment-1564180365   3         3         3       25s
    nginx-deployment-2035384211   0         0         0       36s
    nginx-deployment-3066724191   1         1         0       6s
    kubectl get pods
    NAME                                READY     STATUS             RESTARTS   AGE
    nginx-deployment-1564180365-70iae   1/1       Running            0          25s
    nginx-deployment-1564180365-jbqqo   1/1       Running            0          25s
    nginx-deployment-1564180365-hysrc   1/1       Running            0          25s
    nginx-deployment-3066724191-08mng   0/1       ImagePullBackOff   0          6s
    kubectl describe deployment
    Name:           nginx-deployment
    Namespace:      default
    CreationTimestamp:  Tue, 15 Mar 2016 14:48:04 -0700
    Labels:         app=nginx
    Selector:       app=nginx
    Replicas:       3 desired | 1 updated | 4 total | 3 available | 1 unavailable
    StrategyType:       RollingUpdate
    MinReadySeconds:    0
    RollingUpdateStrategy:  25% max unavailable, 25% max surge
    Pod Template:
      Labels:  app=nginx
      Containers:
       nginx:
        Image:        nginx:1.161
        Port:         80/TCP
        Host Port:    0/TCP
        Environment:  <none>
        Mounts:       <none>
      Volumes:        <none>
    Conditions:
      Type           Status  Reason
      ----           ------  ------
      Available      True    MinimumReplicasAvailable
      Progressing    True    ReplicaSetUpdated
    OldReplicaSets:     nginx-deployment-1564180365 (3/3 replicas created)
    NewReplicaSet:      nginx-deployment-3066724191 (1/1 replicas created)
    Events:
      FirstSeen LastSeen    Count   From                    SubObjectPath   Type        Reason              Message
      --------- --------    -----   ----                    -------------   --------    ------              -------
      1m        1m          1       {deployment-controller }                Normal      ScalingReplicaSet   Scaled up replica set nginx-deployment-2035384211 to 3
      22s       22s         1       {deployment-controller }                Normal      ScalingReplicaSet   Scaled up replica set nginx-deployment-1564180365 to 1
      22s       22s         1       {deployment-controller }                Normal      ScalingReplicaSet   Scaled down replica set nginx-deployment-2035384211 to 2
      22s       22s         1       {deployment-controller }                Normal      ScalingReplicaSet   Scaled up replica set nginx-deployment-1564180365 to 2
      21s       21s         1       {deployment-controller }                Normal      ScalingReplicaSet   Scaled down replica set nginx-deployment-2035384211 to 1
      21s       21s         1       {deployment-controller }                Normal      ScalingReplicaSet   Scaled up replica set nginx-deployment-1564180365 to 3
      13s       13s         1       {deployment-controller }                Normal      ScalingReplicaSet   Scaled down replica set nginx-deployment-2035384211 to 0
      13s       13s         1       {deployment-controller }                Normal      ScalingReplicaSet   Scaled up replica set nginx-deployment-3066724191 to 1
    kubectl rollout history deployment/nginx-deployment --revision=2
    deployments "nginx-deployment" revision 2
      Labels:       app=nginx
              pod-template-hash=1159050644
      Annotations:  kubernetes.io/change-cause=kubectl set image deployment/nginx-deployment nginx=nginx:1.16.1
      Containers:
       nginx:
        Image:      nginx:1.16.1
        Port:       80/TCP
         QoS Tier:
            cpu:      BestEffort
            memory:   BestEffort
        Environment Variables:      <none>
      No volumes.
    kubectl get deployment nginx-deployment
    NAME               READY   UP-TO-DATE   AVAILABLE   AGE
    nginx-deployment   3/3     3            3           30m
    kubectl describe deployment nginx-deployment
    Name:                   nginx-deployment
    Namespace:              default
    CreationTimestamp:      Sun, 02 Sep 2018 18:17:55 -0500
    Labels:                 app=nginx
    Annotations:            deployment.kubernetes.io/revision=4
                            kubernetes.io/change-cause=kubectl set image deployment/nginx-deployment nginx=nginx:1.16.1
    Selector:               app=nginx
    Replicas:               3 desired | 3 updated | 3 total | 3 available | 0 unavailable
    StrategyType:           RollingUpdate
    MinReadySeconds:        0
    RollingUpdateStrategy:  25% max unavailable, 25% max surge
    Pod Template:
      Labels:  app=nginx
      Containers:
       nginx:
        Image:        nginx:1.16.1
        Port:         80/TCP
        Host Port:    0/TCP
        Environment:  <none>
        Mounts:       <none>
      Volumes:        <none>
    Conditions:
      Type           Status  Reason
      ----           ------  ------
      Available      True    MinimumReplicasAvailable
      Progressing    True    NewReplicaSetAvailable
    OldReplicaSets:  <none>
    NewReplicaSet:   nginx-deployment-c4747d96c (3/3 replicas created)
    Events:
      Type    Reason              Age   From                   Message
      ----    ------              ----  ----                   -------
      Normal  ScalingReplicaSet   12m   deployment-controller  Scaled up replica set nginx-deployment-75675f5897 to 3
      Normal  ScalingReplicaSet   11m   deployment-controller  Scaled up replica set nginx-deployment-c4747d96c to 1
      Normal  ScalingReplicaSet   11m   deployment-controller  Scaled down replica set nginx-deployment-75675f5897 to 2
      Normal  ScalingReplicaSet   11m   deployment-controller  Scaled up replica set nginx-deployment-c4747d96c to 2
      Normal  ScalingReplicaSet   11m   deployment-controller  Scaled down replica set nginx-deployment-75675f5897 to 1
      Normal  ScalingReplicaSet   11m   deployment-controller  Scaled up replica set nginx-deployment-c4747d96c to 3
      Normal  ScalingReplicaSet   11m   deployment-controller  Scaled down replica set nginx-deployment-75675f5897 to 0
      Normal  ScalingReplicaSet   11m   deployment-controller  Scaled up replica set nginx-deployment-595696685f to 1
      Normal  DeploymentRollback  15s   deployment-controller  Rolled back deployment "nginx-deployment" to revision 2
      Normal  ScalingReplicaSet   15s   deployment-controller  Scaled down replica set nginx-deployment-595696685f to 0
    kubectl set image deployment/nginx-deployment nginx=nginx:1.16.1
    deployment.apps/nginx-deployment image updated
    kubectl rollout history deployment/nginx-deployment
    deployments "nginx"
    REVISION  CHANGE-CAUSE
    1   <none>
    kubectl get rs
    NAME               DESIRED   CURRENT   READY     AGE
    nginx-2142116321   3         3         3         2m
    kubectl set resources deployment/nginx-deployment -c=nginx --limits=cpu=200m,memory=512Mi
    deployment.apps/nginx-deployment resource requirements updated
    kubectl rollout resume deployment/nginx-deployment
    deployment.apps/nginx-deployment resumed
    kubectl get rs -w
    NAME               DESIRED   CURRENT   READY     AGE
    nginx-2142116321   2         2         2         2m
    nginx-3926361531   2         2         0         6s
    nginx-3926361531   2         2         1         18s
    nginx-2142116321   1         2         2         2m
    nginx-2142116321   1         2         2         2m
    nginx-3926361531   3         2         1         18s
    nginx-3926361531   3         2         1         18s
    nginx-2142116321   1         1         1         2m
    nginx-3926361531   3         3         1         18s
    nginx-3926361531   3         3         2         19s
    nginx-2142116321   0         1         1         2m
    nginx-2142116321   0         1         1         2m
    nginx-2142116321   0         0         0         2m
    nginx-3926361531   3         3         3         20s
    kubectl get rs
    NAME               DESIRED   CURRENT   READY     AGE
    nginx-2142116321   0         0         0         2m
    nginx-3926361531   3         3         3         28s
    apiVersion: apps/v1
    kind: ReplicaSet
    metadata:
      name: frontend
      labels:
        app: guestbook
        tier: frontend
    spec:
      # modify replicas according to your case
      replicas: 3
      selector:
        matchLabels:
          tier: frontend
      template:
        metadata:
          labels:
            tier: frontend
        spec:
          containers:
          - name: php-redis
            image: gcr.io/google_samples/gb-frontend:v3
    kubectl apply -f https://kubernetes.io/examples/controllers/frontend.yaml
    kubectl get rs
    NAME       DESIRED   CURRENT   READY   AGE
    frontend   3         3         3       6s
    kubectl describe rs/frontend
    Name:         frontend
    Namespace:    default
    Selector:     tier=frontend
    Labels:       app=guestbook
                  tier=frontend
    Annotations:  kubectl.kubernetes.io/last-applied-configuration:
                    {"apiVersion":"apps/v1","kind":"ReplicaSet","metadata":{"annotations":{},"labels":{"app":"guestbook","tier":"frontend"},"name":"frontend",...
    Replicas:     3 current / 3 desired
    Pods Status:  3 Running / 0 Waiting / 0 Succeeded / 0 Failed
    Pod Template:
      Labels:  tier=frontend
      Containers:
       php-redis:
        Image:        gcr.io/google_samples/gb-frontend:v3
        Port:         <none>
        Host Port:    <none>
        Environment:  <none>
        Mounts:       <none>
      Volumes:        <none>
    Events:
      Type    Reason            Age   From                   Message
      ----    ------            ----  ----                   -------
      Normal  SuccessfulCreate  117s  replicaset-controller  Created pod: frontend-wtsmm
      Normal  SuccessfulCreate  116s  replicaset-controller  Created pod: frontend-b2zdv
      Normal  SuccessfulCreate  116s  replicaset-controller  Created pod: frontend-vcmts
    kubectl get pods
    NAME             READY   STATUS    RESTARTS   AGE
    frontend-b2zdv   1/1     Running   0          6m36s
    frontend-vcmts   1/1     Running   0          6m36s
    frontend-wtsmm   1/1     Running   0          6m36s
    kubectl get pods frontend-b2zdv -o yaml
    apiVersion: v1
    kind: Pod
    metadata:
      creationTimestamp: "2020-02-12T07:06:16Z"
      generateName: frontend-
      labels:
        tier: frontend
      name: frontend-b2zdv
      namespace: default
      ownerReferences:
      - apiVersion: apps/v1
        blockOwnerDeletion: true
        controller: true
        kind: ReplicaSet
        name: frontend
        uid: f391f6db-bb9b-4c09-ae74-6a1f77f3d5cf
    ...
    apiVersion: v1
    kind: Pod
    metadata:
      name: pod1
      labels:
        tier: frontend
    spec:
      containers:
      - name: hello1
        image: gcr.io/google-samples/hello-app:2.0
    
    ---
    
    apiVersion: v1
    kind: Pod
    metadata:
      name: pod2
      labels:
        tier: frontend
    spec:
      containers:
      - name: hello2
        image: gcr.io/google-samples/hello-app:1.0
    kubectl apply -f https://kubernetes.io/examples/pods/pod-rs.yaml
    kubectl get pods
    NAME             READY   STATUS        RESTARTS   AGE
    frontend-b2zdv   1/1     Running       0          10m
    frontend-vcmts   1/1     Running       0          10m
    frontend-wtsmm   1/1     Running       0          10m
    pod1             0/1     Terminating   0          1s
    pod2             0/1     Terminating   0          1s
    kubectl apply -f https://kubernetes.io/examples/pods/pod-rs.yaml
    kubectl apply -f https://kubernetes.io/examples/controllers/frontend.yaml
    kubectl get pods
    NAME             READY   STATUS    RESTARTS   AGE
    frontend-hmmj2   1/1     Running   0          9s
    pod1             1/1     Running   0          36s
    pod2             1/1     Running   0          36s
    matchLabels:
      tier: frontend
    kubectl proxy --port=8080
    curl -X DELETE  'localhost:8080/apis/apps/v1/namespaces/default/replicasets/frontend' \
      -d '{"kind":"DeleteOptions","apiVersion":"v1","propagationPolicy":"Foreground"}' \
      -H "Content-Type: application/json"
    kubectl proxy --port=8080
    curl -X DELETE  'localhost:8080/apis/apps/v1/namespaces/default/replicasets/frontend' \
      -d '{"kind":"DeleteOptions","apiVersion":"v1","propagationPolicy":"Orphan"}' \
      -H "Content-Type: application/json"
    apiVersion: autoscaling/v1
    kind: HorizontalPodAutoscaler
    metadata:
      name: frontend-scaler
    spec:
      scaleTargetRef:
        kind: ReplicaSet
        name: frontend
      minReplicas: 3
      maxReplicas: 10
      targetCPUUtilizationPercentage: 50
    kubectl apply -f https://k8s.io/examples/controllers/hpa-rs.yaml
    kubectl autoscale rs frontend --max=10 --min=3 --cpu-percent=50
    apiVersion: v1
    kind: ReplicationController
    metadata:
      name: nginx
    spec:
      replicas: 3
      selector:
        app: nginx
      template:
        metadata:
          name: nginx
          labels:
            app: nginx
        spec:
          containers:
          - name: nginx
            image: nginx
            ports:
            - containerPort: 80
    kubectl apply -f https://k8s.io/examples/controllers/replication.yaml
    replicationcontroller/nginx created
    kubectl describe replicationcontrollers/nginx
    Name:        nginx
    Namespace:   default
    Selector:    app=nginx
    Labels:      app=nginx
    Annotations:    <none>
    Replicas:    3 current / 3 desired
    Pods Status: 0 Running / 3 Waiting / 0 Succeeded / 0 Failed
    Pod Template:
      Labels:       app=nginx
      Containers:
       nginx:
        Image:              nginx
        Port:               80/TCP
        Environment:        <none>
        Mounts:             <none>
      Volumes:              <none>
    Events:
      FirstSeen       LastSeen     Count    From                        SubobjectPath    Type      Reason              Message
      ---------       --------     -----    ----                        -------------    ----      ------              -------
      20s             20s          1        {replication-controller }                    Normal    SuccessfulCreate    Created pod: nginx-qrm3m
      20s             20s          1        {replication-controller }                    Normal    SuccessfulCreate    Created pod: nginx-3ntk0
      20s             20s          1        {replication-controller }                    Normal    SuccessfulCreate    Created pod: nginx-4ok8v
    Pods Status:    3 Running / 0 Waiting / 0 Succeeded / 0 Failed
    pods=$(kubectl get pods --selector=app=nginx --output=jsonpath={.items..metadata.name})
    echo $pods
    nginx-3ntk0 nginx-4ok8v nginx-qrm3m
    apiVersion: apps/v1
    kind: Deployment
    metadata:
      name: nginx-deployment
      labels:
        app: nginx
    spec:
      replicas: 3
      selector:
        matchLabels:
          app: nginx
      template:
        metadata:
          labels:
            app: nginx
        spec:
          containers:
          - name: nginx
            image: nginx:1.14.2
            ports:
            - containerPort: 80
    kubectl apply -f https://k8s.io/examples/controllers/nginx-deployment.yaml
    NAME               READY   UP-TO-DATE   AVAILABLE   AGE
    nginx-deployment   0/3     0            0           1s
    kubectl set image deployment.v1.apps/nginx-deployment nginx=nginx:1.16.1
    kubectl set image deployment/nginx-deployment nginx=nginx:1.16.1
    NAME               READY   UP-TO-DATE   AVAILABLE   AGE
    nginx-deployment   3/3     3            3           36s
    kubectl get rs
    NAME                          DESIRED   CURRENT   READY   AGE
    nginx-deployment-1564180365   3         3         3       6s
    nginx-deployment-2035384211   0         0         0       36s
    kubectl set image deployment/nginx-deployment nginx=nginx:1.161
    deployment.apps/nginx-deployment image updated
    kubectl rollout status deployment/nginx-deployment
    kubectl rollout history deployment/nginx-deployment
    deployments "nginx-deployment"
    REVISION    CHANGE-CAUSE
    1           kubectl apply --filename=https://k8s.io/examples/controllers/nginx-deployment.yaml
    2           kubectl set image deployment/nginx-deployment nginx=nginx:1.16.1
    3           kubectl set image deployment/nginx-deployment nginx=nginx:1.161
    kubectl rollout undo deployment/nginx-deployment
    deployment.apps/nginx-deployment rolled back
    kubectl rollout undo deployment/nginx-deployment --to-revision=2
    deployment.apps/nginx-deployment rolled back
    kubectl scale deployment/nginx-deployment --replicas=10
    deployment.apps/nginx-deployment scaled
    kubectl autoscale deployment/nginx-deployment --min=10 --max=15 --cpu-percent=80
    deployment.apps/nginx-deployment scaled
    kubectl get deploy
    NAME                 DESIRED   CURRENT   UP-TO-DATE   AVAILABLE   AGE
    nginx-deployment     10        10        10           10          50s
    kubectl set image deployment/nginx-deployment nginx=nginx:sometag
    deployment.apps/nginx-deployment image updated
    kubectl get deploy
    NAME                 DESIRED   CURRENT   UP-TO-DATE   AVAILABLE   AGE
    nginx-deployment     15        18        7            8           7m
    kubectl get rs
    NAME                          DESIRED   CURRENT   READY     AGE
    nginx-deployment-1989198191   7         7         0         7m
    nginx-deployment-618515232    11        11        11        7m
    kubectl get deploy
    NAME      DESIRED   CURRENT   UP-TO-DATE   AVAILABLE   AGE
    nginx     3         3         3            3           1m
    kubectl get rs
    NAME               DESIRED   CURRENT   READY     AGE
    nginx-2142116321   3         3         3         1m
    kubectl rollout status deployment/nginx-deployment
    Waiting for rollout to finish: 2 of 3 updated replicas are available...
    deployment "nginx-deployment" successfully rolled out
    echo $?
    0
    kubectl patch deployment/nginx-deployment -p '{"spec":{"progressDeadlineSeconds":600}}'
    deployment.apps/nginx-deployment patched
    kubectl describe deployment nginx-deployment
    <...>
    Conditions:
      Type            Status  Reason
      ----            ------  ------
      Available       True    MinimumReplicasAvailable
      Progressing     True    ReplicaSetUpdated
      ReplicaFailure  True    FailedCreate
    <...>
    status:
      availableReplicas: 2
      conditions:
      - lastTransitionTime: 2016-10-04T12:25:39Z
        lastUpdateTime: 2016-10-04T12:25:39Z
        message: Replica set "nginx-deployment-4262182780" is progressing.
        reason: ReplicaSetUpdated
        status: "True"
        type: Progressing
      - lastTransitionTime: 2016-10-04T12:25:42Z
        lastUpdateTime: 2016-10-04T12:25:42Z
        message: Deployment has minimum availability.
        reason: MinimumReplicasAvailable
        status: "True"
        type: Available
      - lastTransitionTime: 2016-10-04T12:25:39Z
        lastUpdateTime: 2016-10-04T12:25:39Z
        message: 'Error creating: pods "nginx-deployment-4262182780-" is forbidden: exceeded quota:
          object-counts, requested: pods=1, used: pods=3, limited: pods=2'
        reason: FailedCreate
        status: "True"
        type: ReplicaFailure
      observedGeneration: 3
      replicas: 2
      unavailableReplicas: 2
    Conditions:
      Type            Status  Reason
      ----            ------  ------
      Available       True    MinimumReplicasAvailable
      Progressing     False   ProgressDeadlineExceeded
      ReplicaFailure  True    FailedCreate
    Conditions:
      Type          Status  Reason
      ----          ------  ------
      Available     True    MinimumReplicasAvailable
      Progressing   True    NewReplicaSetAvailable
    kubectl rollout status deployment/nginx-deployment
    Waiting for rollout to finish: 2 out of 3 new replicas have been updated...
    error: deployment "nginx" exceeded its progress deadline
    echo $?
    1
    apiVersion: v1
    kind: Service
    metadata:
      name: nginx
      labels:
        app: nginx
    spec:
      ports:
      - port: 80
        name: web
      clusterIP: None
      selector:
        app: nginx
    ---
    apiVersion: apps/v1
    kind: StatefulSet
    metadata:
      name: web
    spec:
      selector:
        matchLabels:
          app: nginx # has to match .spec.template.metadata.labels
      serviceName: "nginx"
      replicas: 3 # by default is 1
      minReadySeconds: 10 # by default is 0
      template:
        metadata:
          labels:
            app: nginx # has to match .spec.selector.matchLabels
        spec:
          terminationGracePeriodSeconds: 10
          containers:
          - name: nginx
            image: registry.k8s.io/nginx-slim:0.8
            ports:
            - containerPort: 80
              name: web
            volumeMounts:
            - name: www
              mountPath: /usr/share/nginx/html
      volumeClaimTemplates:
      - metadata:
          name: www
        spec:
          accessModes: [ "ReadWriteOnce" ]
          storageClassName: "my-storage-class"
          resources:
            requests:
              storage: 1Gi
    apiVersion: apps/v1
    kind: StatefulSet
    ...
    spec:
      persistentVolumeClaimRetentionPolicy:
        whenDeleted: Retain
        whenScaled: Delete
    ...
    apiVersion: apps/v1
    kind: DaemonSet
    metadata:
      name: fluentd-elasticsearch
      namespace: kube-system
      labels:
        k8s-app: fluentd-logging
    spec:
      selector:
        matchLabels:
          name: fluentd-elasticsearch
      template:
        metadata:
          labels:
            name: fluentd-elasticsearch
        spec:
          tolerations:
          # these tolerations are to have the daemonset runnable on control plane nodes
          # remove them if your control plane nodes should not run pods
          - key: node-role.kubernetes.io/control-plane
            operator: Exists
            effect: NoSchedule
          - key: node-role.kubernetes.io/master
            operator: Exists
            effect: NoSchedule
          containers:
          - name: fluentd-elasticsearch
            image: quay.io/fluentd_elasticsearch/fluentd:v2.5.2
            resources:
              limits:
                memory: 200Mi
              requests:
                cpu: 100m
                memory: 200Mi
            volumeMounts:
            - name: varlog
              mountPath: /var/log
          terminationGracePeriodSeconds: 30
          volumes:
          - name: varlog
            hostPath:
              path: /var/log
    kubectl apply -f https://k8s.io/examples/controllers/daemonset.yaml
    nodeAffinity:
      requiredDuringSchedulingIgnoredDuringExecution:
        nodeSelectorTerms:
        - matchFields:
          - key: metadata.name
            operator: In
            values:
            - target-host-name
    apiVersion: batch/v1
    kind: Job
    metadata:
      name: pi
    spec:
      template:
        spec:
          containers:
          - name: pi
            image: perl:5.34.0
            command: ["perl",  "-Mbignum=bpi", "-wle", "print bpi(2000)"]
          restartPolicy: Never
      backoffLimit: 4
    
    kubectl apply -f https://kubernetes.io/examples/controllers/job.yaml
    job.batch/pi created
    
    Name:           pi
    Namespace:      default
    Selector:       batch.kubernetes.io/controller-uid=c9948307-e56d-4b5d-8302-ae2d7b7da67c
    Labels:         batch.kubernetes.io/controller-uid=c9948307-e56d-4b5d-8302-ae2d7b7da67c
                    batch.kubernetes.io/job-name=pi
                    ...
    Annotations:    batch.kubernetes.io/job-tracking: ""
    Parallelism:    1
    Completions:    1
    Start Time:     Mon, 02 Dec 2019 15:20:11 +0200
    Completed At:   Mon, 02 Dec 2019 15:21:16 +0200
    Duration:       65s
    Pods Statuses:  0 Running / 1 Succeeded / 0 Failed
    Pod Template:
      Labels:  batch.kubernetes.io/controller-uid=c9948307-e56d-4b5d-8302-ae2d7b7da67c
               batch.kubernetes.io/job-name=pi
      Containers:
       pi:
        Image:      perl:5.34.0
        Port:       <none>
        Host Port:  <none>
        Command:
          perl
          -Mbignum=bpi
          -wle
          print bpi(2000)
        Environment:  <none>
        Mounts:       <none>
      Volumes:        <none>
    Events:
      Type    Reason            Age   From            Message
      ----    ------            ----  ----            -------
      Normal  SuccessfulCreate  21s   job-controller  Created pod: pi-xf9p4
      Normal  Completed         18s   job-controller  Job completed
    pods=$(kubectl get pods --selector=batch.kubernetes.io/job-name=pi --output=jsonpath='{.items[*].metadata.name}')
    echo $pods
    pi-5rwd7
    kubectl logs $pods
    kubectl logs jobs/pi
    3.1415926535897932384626433832795028841971693993751058209749445923078164062862089986280348253421170679821480865132823066470938446095505822317253594081284811174502841027019385211055596446229489549303819644288109756659334461284756482337867831652712019091456485669234603486104543266482133936072602491412737245870066063155881748815209209628292540917153643678925903600113305305488204665213841469519415116094330572703657595919530921861173819326117931051185480744623799627495673518857527248912279381830119491298336733624406566430860213949463952247371907021798609437027705392171762931767523846748184676694051320005681271452635608277857713427577896091736371787214684409012249534301465495853710507922796892589235420199561121290219608640344181598136297747713099605187072113499999983729780499510597317328160963185950244594553469083026425223082533446850352619311881710100031378387528865875332083814206171776691473035982534904287554687311595628638823537875937519577818577805321712268066130019278766111959092164201989380952572010654858632788659361533818279682303019520353018529689957736225994138912497217752834791315155748572424541506959508295331168617278558890750983817546374649393192550604009277016711390098488240128583616035637076601047101819429555961989467678374494482553797747268471040475346462080466842590694912933136770289891521047521620569660240580381501935112533824300355876402474964732639141992726042699227967823547816360093417216412199245863150302861829745557067498385054945885869269956909272107975093029553211653449872027559602364806654991198818347977535663698074265425278625518184175746728909777727938000816470600161452491921732172147723501414419735685481613611573525521334757418494684385233239073941433345477624168625189835694855620992192221842725502542568876717904946016534668049886272327917860857843838279679766814541009538837863609506800642251252051173929848960841284886269456042419652850222106611863067442786220391949450471237137869609563643719172874677646575739624138908658326459958133904780275901
    apiVersion: batch/v1
    kind: Job
    metadata:
      name: job-pod-failure-policy-example
    spec:
      completions: 12
      parallelism: 3
      template:
        spec:
          restartPolicy: Never
          containers:
          - name: main
            image: docker.io/library/bash:5
            command: ["bash"]        # example command simulating a bug which triggers the FailJob action
            args:
            - -c
            - echo "Hello world!" && sleep 5 && exit 42
      backoffLimit: 6
      podFailurePolicy:
        rules:
        - action: FailJob
          onExitCodes:
            containerName: main      # optional
            operator: In             # one of: In, NotIn
            values: [42]
        - action: Ignore             # one of: Ignore, FailJob, Count
          onPodConditions:
          - type: DisruptionTarget   # indicates Pod disruption
    apiVersion: batch/v1
    kind: Job
    metadata:
      name: pi-with-timeout
    spec:
      backoffLimit: 5
      activeDeadlineSeconds: 100
      template:
        spec:
          containers:
          - name: pi
            image: perl:5.34.0
            command: ["perl",  "-Mbignum=bpi", "-wle", "print bpi(2000)"]
          restartPolicy: Never
    apiVersion: batch/v1
    kind: Job
    metadata:
      name: pi-with-ttl
    spec:
      ttlSecondsAfterFinished: 100
      template:
        spec:
          containers:
          - name: pi
            image: perl:5.34.0
            command: ["perl",  "-Mbignum=bpi", "-wle", "print bpi(2000)"]
          restartPolicy: Never
    kubectl get job myjob -o yaml
    apiVersion: batch/v1
    kind: Job
    metadata:
      name: myjob
    spec:
      suspend: true
      parallelism: 1
      completions: 5
      template:
        spec:
          ...
    kubectl patch job/myjob --type=strategic --patch '{"spec":{"suspend":true}}'
    kubectl patch job/myjob --type=strategic --patch '{"spec":{"suspend":false}}'
    kubectl get jobs/myjob -o yaml
    apiVersion: batch/v1
    kind: Job
    # .metadata and .spec omitted
    status:
      conditions:
      - lastProbeTime: "2021-02-05T13:14:33Z"
        lastTransitionTime: "2021-02-05T13:14:33Z"
        status: "True"
        type: Suspended
      startTime: "2021-02-05T13:13:48Z"
    kubectl describe jobs/myjob
    Name:           myjob
    ...
    Events:
      Type    Reason            Age   From            Message
      ----    ------            ----  ----            -------
      Normal  SuccessfulCreate  12m   job-controller  Created pod: myjob-hlrpl
      Normal  SuccessfulDelete  11m   job-controller  Deleted pod: myjob-hlrpl
      Normal  Suspended         11m   job-controller  Job suspended
      Normal  SuccessfulCreate  3s    job-controller  Created pod: myjob-jvb44
      Normal  Resumed           3s    job-controller  Job resumed
    kubectl get job old -o yaml
    kind: Job
    metadata:
      name: old
      ...
    spec:
      selector:
        matchLabels:
          batch.kubernetes.io/controller-uid: a8f3d00d-c6d2-11e5-9f87-42010af00002
      ...
    kind: Job
    metadata:
      name: new
      ...
    spec:
      manualSelector: true
      selector:
        matchLabels:
          batch.kubernetes.io/controller-uid: a8f3d00d-c6d2-11e5-9f87-42010af00002
      ...
    deployment.apps/nginx-deployment image updated
    kubectl edit deployment/nginx-deployment
    deployment.apps/nginx-deployment edited
    Waiting for rollout to finish: 1 out of 3 new replicas have been updated...
    kubectl get rs
    NAME                          DESIRED   CURRENT   READY     AGE
    nginx-deployment-1989198191   5         5         0         9s
    nginx-deployment-618515232    8         8         8         1m
    kubectl rollout pause deployment/nginx-deployment
    deployment.apps/nginx-deployment paused
    apiVersion: networking.k8s.io/v1
    kind: Ingress
    metadata:
      name: ingress
    spec:
      rules:
      - host: "nginx-ingress.kubernetes.saasx.io"
        http:
          paths:
          - pathType: Prefix
            path: "/"
            backend:
              service:
                name: my-nginx-svc
                port:
                  number: 80
    apiVersion: networking.k8s.io/v1
    kind: Ingress
    metadata:
      name: ingress
    spec:
      rules:
      - host: "wp-ingress.kubernetes.saasx.io"
        http:
          paths:
          - pathType: Prefix
            path: "/"
            backend:
              service:
                name: wordpress
                port:
                  number: 80
    kubectl create configmap <map-name> <data-source>
    apiVersion: v1
    kind: ConfigMap
    metadata:
      name: game-demo
    data:
      # property-like keys; each key maps to a simple value
      player_initial_lives: "3"
      ui_properties_file_name: "user-interface.properties"
    
      # file-like keys
      game.properties: |
        enemy.types=aliens,monsters
        player.maximum-lives=5
      user-interface.properties: |
        color.good=purple
        color.bad=yellow
        allow.textmode=true
    apiVersion: v1
    kind: ConfigMap
    metadata:
      ...
    data:
      ...
    immutable: true
     kubectl edit secrets mysecret
    kubectl create configmap language --from-literal=LANGUAGE=Spanish \
            -o yaml --dry-run | kubectl replace -f -
    kubectl create secret generic apikey --from-literal=API_KEY=098765 \
            -o yaml --dry-run | kubectl replace -f -
    kubectl delete pod -l name=envtest
    Docker Hubarrow-up-right
    node.kubernetes.io/memory-pressurearrow-up-right
    node.kubernetes.io/pid-pressurearrow-up-right
    node.kubernetes.io/unschedulablearrow-up-right
    node.kubernetes.io/network-unavailablearrow-up-right
    Indexed Job with Static Work Assignmentarrow-up-right
    Job Template Expansionarrow-up-right
    Job with Pod-to-Pod Communicationarrow-up-right
    Job with Pod-to-Pod Communicationarrow-up-right

    Amazon RDS for SQL Server

    SQL Server is a relational database management system developed by Microsoft. Amazon RDS for SQL Server makes it easy to set up, operate, and scale SQL Server deployments in the cloud. With Amazon RDS, you can deploy multiple editions of SQL Server (2012, 2014, 2016, 2017 and 2019) including Express, Web, Standard and Enterprise, in minutes with cost-efficient and re-sizable compute capacity. Amazon RDS frees you up to focus on application development by managing time-consuming database administration tasks including provisioning, backups, software patching, monitoring, and hardware scaling.

    Amazon RDS for SQL Server supports the “License Included” licensing model. You do not need separately purchased Microsoft SQL Server licenses. "License Included" pricing is inclusive of software, underlying hardware resources, and Amazon RDS management capabilities.

    You can take advantage of hourly pricing with no upfront fees or long-term commitments. In addition, you also have the option to purchase Reserved DB Instances under one or three year reservation terms. With Reserved DB Instances, you can make low, one-time, upfront payment for each DB Instance and then pay a significantly discounted hourly usage rate, achieving up to 65% net cost savings.

    Amazon RDS for SQL Server DB Instances can be provisioned with either standard storage or Provisioned IOPS storage. Amazon RDS Provisioned IOPS is a storage option designed to deliver fast, predictable, and consistent I/O performance, and is optimized for I/O-intensive, transactional (OLTP) database workloads.

    hashtag
    Benefits

    hashtag
    Fully managed

    Amazon RDS for SQL Server is fully managed by Amazon Relational Database Service (RDS). You no longer need to worry about database management tasks such as hardware provisioning, software patching, setup, configuration, or backups.

    hashtag
    Single click high availability

    With a single click, you can enable the Multi-AZ option, replicating data synchronously across different availability zones. In case the primary node crashes, your database will automatically fail over to the secondary and we will automatically re-build the secondary.

    hashtag
    Auto-scaled storage

    By opting into Auto-Scale storage, instances will automatically increase the storage size with zero downtime. With RDS Storage Auto Scaling, you simply set your desired maximum storage limit, and Auto Scaling takes care of the rest.

    hashtag
    Automated backups

    Amazon RDS creates and saves automated backups of your SQL Server instance. Amazon RDS creates a storage volume snapshot of your instance, backing up the entire instance and not just individual databases. Amazon RDS for SQL Server creates automated backups of your DB instance during the backup window of your DB instance.

    hashtag
    Upgrade and modernize

    Amazon RDS SQL Server offers Enterprise, Standard Edition, Web, and Express Editions for SQL Server Versions 2012, 2014, 2016, 2017, and 2019. For SQL Server 2008 R2 (now deprecated) customers can still keep their database compatibility in 2008 and migrate to a new versions with minimal changes.

    hashtag
    Ease of migration

    We support a number of ways to migrate to Amazon RDS SQL Server, including Single and Multi-file native restores, Microsoft SQL Server Database Publishing Wizard, Import/Export, Amazon Database Migration Service, and SQL Server Replication.

    Amazon RDS for Oracle

    Amazon RDS for Oracle is a fully managed commercial database that makes it easy to set up, operate, and scale Oracle deployments in the cloud. Amazon RDS frees you up to focus on innovation and application development by managing time-consuming database administration tasks including provisioning, backups, software patching, monitoring, and hardware scaling. You can run Amazon RDS for Oracle under two different licensing models – “License Included” and “Bring-Your-Own-License (BYOL)”. In the "License Included" service model, you do not need separately purchased Oracle licenses; the Oracle Database software has been licensed by Amazon Web Services.

    You can take advantage of hourly pricing with no upfront fees or long-term commitments. In addition, you also have the option to purchase Reserved DB Instances under one or three year reservation terms. With Reserved DB Instances, you can make low, one-time, upfront payment for each DB Instance and then pay a significantly discounted hourly usage rate, achieving up to 48% net cost savings.

    hashtag
    Benefits

    hashtag
    Fully managed

    Amazon RDS for Oracle is fully managed by Amazon Relational Database Service (RDS). You no longer need to worry about database management tasks such as hardware provisioning, software patching, setup, configuration, or backups.

    hashtag
    Availability and reliability

    Amazon RDS for Oracle makes it easy to use replication to enhance availability and reliability for production workloads. Using the Multi-AZ deployment option you can run mission critical workloads with high availability and built-in automated fail-over from your primary database to a synchronously replicated secondary database in case of a failure.

    hashtag
    Ease of migration

    Amazon RDS for Oracle gives you the full benefits of a managed service solution. You can use the lift-and-shift approach to migrate your legacy Oracle database to Amazon RDS for Oracle and, as a result, reduce the need to refactor and change existing application components.

    hashtag
    Fast, predictable performance

    Amazon RDS instances supports up to 64 TiB of storage built on high-performance Amazon Elastic Block Store (EBS) SSD volumes. Amazon RDS General Purpose (SSD) storage delivers a consistent baseline of 3 IOPS per provisioned GB and provides the ability to burst up to 12,000 IOPS. With provisioned IOPS, you can provision up to 256,000 IOPS per database instance.

    hashtag
    License flexibility

    You can run Amazon RDS for Oracle under two different licensing models - "License Included" and "Bring-Your-Own-License (BYOL)". In the "License Included" service model, you do not need separately purchased Oracle licenses.

    hashtag
    Multiple availability zones

    Using the Multi-AZ deployment option you can run mission critical workloads with high availability and built-in automated fail-over from your primary database to a synchronously replicated secondary database in case of a failure. As with all Amazon Web Services, there are no up-front investments required, and you pay only for the resources you use.

    Step 1: Create secret with password
    apiVersion: apps/v1
    kind: ReplicaSet
    metadata:
      namespace: yourname
      name: frontend
      labels:
        app: guestbook
        tier: frontend
    spec:
      # modify replicas according to your case
      replicas: 3
      selector:
        matchLabels:
          tier: frontend
      template:
        metadata:
          labels:
            tier: frontend
        spec:
          containers:
          - name: php-redis
            image: gcr.io/google_samples/gb-frontend:v3
    echo -n 'devops' | base64
    apiVersion: v1
    kind: Secret
    metadata:
      namespace: yourname
      name: mysql-pass
    type: Opaque
    data:
      password: ZGV2b3Bz
    apiVersion: v1
    kind: PersistentVolumeClaim
    metadata:
      namespace: yourname
      name: mysql-pv-claim
      labels:
        app: wordpress
    spec:
      accessModes:
       - ReadWriteOnce
      resources:
       requests:
        storage: 40Gi
    apiVersion: apps/v1
    kind: StatefulSet
    metadata:
      namespace: yourname
      name: wordpress-mysql
      labels:
        app: wordpress
    spec:
      selector:
        matchLabels:
          app: wordpress
          tier: mysql
      template:
        metadata:
          labels:
            app: wordpress
            tier: mysql
        spec:
          containers:
            - image: mysql:5.6
              name: mysql
              env:
                - name: MYSQL_ROOT_PASSWORD
                  valueFrom:
                    secretKeyRef:
                      name: mysql-pass
                      key: password
              ports:
                - containerPort: 3306
                  name: mysql
              volumeMounts:
                - name: mysql-persistent-storage
                  mountPath: /var/lib/mysql
          volumes:
            - name: mysql-persistent-storage
              persistentVolumeClaim:
                claimName: mysql-pv-claim
    apiVersion: v1
    kind: Service
    metadata:
      namespace: yourname
      name: wordpress-mysql
      labels:
        app: wordpress
    spec:
      ports:
        - port: 3306
      selector:
        app: wordpress
        tier: mysql
  • Ease of use SNS service is very simple to use as Web-based AWS Management Console offers the simplicity of the point-and-click interface.

  • Simple Architecture SNS is used to simplify the messaging architecture by offloading the message filtering logic from the subscribers and message routing logic from the publishers. Instead of receiving all the messages from the topic, SNS sends the message to subscriber-only of their interest.

  • SQS polling introduces some latency in message delivery while SQS pushing pushed the messages to the subscribers immediately.

    —Kubernetes namespaces let you apply policies to different parts of a cluster. For example, you can define resource policies to limit resource consumption. You can also use container network interfaces (CNIs) to apply network policies that define how communication is achieved between pods in each namespace.
    Learn more about
    .
  • Apply access controls—namespaces let you define role-based access control (RBAC). You can define a role object type and assign it using role binding. The role you define is applied to a namespace, and RoleBinding is applied to specific objects within this namespace. Using this technique can help you improve the security of your cluster.

  • In a new cluster, Kubernetes automatically creates the following namespaces: default (for user workloads) and three namespaces for the Kubernetes control plane: kube-node-lease, kube-public, and kube-system. Kubernetes also allows admins to manually create custom namespaces.

    Related content: Read our guide to Kubernetes architecturearrow-up-right

    In this article:

    • Kubernetes Namespaces Conceptsarrow-up-right

    • The Hierarchical Namespace Controller (HNC)arrow-up-right

    • When Should You Use Multiple Kubernetes Namespaces?arrow-up-right

    hashtag
    Kubernetes Namespaces Concepts

    There are two types of Kubernetes namespaces: Kubernetes system namespaces and custom namespaces.

    Default Kubernetes namespaces

    Here are the four default namespaces Kubernetes creates automatically:

    • default—a default space for objects that do not have a specified namespace.

    • kube-system—a default space for Kubernetes system objects, such as kube-dns and kube-proxy, and add-ons providing cluster-level features, such as web UI dashboards, ingresses, and cluster-level logging.

    • kube-public—a default space for resources available to all users without authentication.

    • kube-node-lease—a default space for objects related to cluster scaling.

    Custom Kubernetes namespaces

    Admins can create as many Kubernetes namespaces as necessary to isolate workloads or resources and limit access to specific users. Here is how to create a namespace using kubectl:

    kubectl create ns mynamespace

    Related content: Read our guide to Kubernetes clustersarrow-up-right

    The Hierarchical Namespace Controller (HNC)

    Hierarchical namespaces are an extension to the Kubernetes namespaces mechanism, which allows you to organize groups of namespaces that have a common owner. For example, when a cluster is shared by multiple teams, each team can have a group of namespaces that belong to them.

    With hierarchical namespaces, you can create a team namespace, and under it namespaces for specific workloads. You don’t need cluster-level permission to create a namespace within your team namespace, and you also have the flexibility to apply different RBAC rules and network security groups at each level of the namespace hierarchy.

    hashtag
    When Should You Use Multiple Kubernetes Namespaces?

    In small projects or teams, where there is no need to isolate workloads or users from each other, it can be reasonable to use the default Kubernetes namespace. Consider using multiple namespaces for the following reasons:

    • Isolation—if you have a large team, or several teams working on the same cluster, you can use namespaces to create separation between projects and microservices. Activity in one namespace never affects the other namespaces.

    • Development stages—if you use the same Kubernetes cluster for multiple stages of the development lifecycle, it is a good idea to separate development, testing, and production environments. You do not want errors or instability in testing environments to affect production users. Ideally, you should use a separate cluster for each environment, but if this is not possible, namespaces can create this separation.

    • Permissions—it might be necessary to define separate permissions for different resources in your cluster. You can define separate RBAC rules for each namespace, ensuring that only authorized roles can access the resources in the namespace. This is especially important for mission critical applications, and to protect sensitive data in production deployments.

    • Resource control—you can define resource limits at the namespace level, ensuring each namespace has access to a certain amount of CPU and memory resources. This enables separating cluster resources among several projects and ensuring each project has the resources it needs, leaving sufficient resources for other projects.

    • Performance—Kubernetes API provides better performance when you define namespaces in the cluster. This is because the API has less items to search through when you perform specific operations.

    hashtag
    Quick Tutorial: Working with Kubernetes Namespaces

    Let’s see how to perform basic namespace operations—creating a namespace, viewing existing namespaces, and creating a pod in a namespace.

    Creating Namespaces

    You can create a namespace with a simple kubectl command, like this:

    kubectl create namespace mynamespace

    This will create a namespace called mynamespace, with default configuration. If you want more control over the namespace, you can create a YAML file and apply it. Here is an example of a namespace YAML file:

    Viewing Namespaces

    To list all the namespaces currently active in your cluster, run this command:

    kubectl get namespace

    The output will look something like this:

    Creating Resources in the Namespace

    When you create a resource in Kubernetes without specifying a namespace, it is automatically created in the current namespace.

    For example, the following pod specification does not specify a namespace:

    When you apply this pod specification, the following will happen:

    • If you did not create any namespaces in your cluster, the pod will be created in the default namespace

    • If you created a namespace and are currently running in it, the pod will be created in that namespace.

    How can you explicitly create a resource in a specific namespace?

    There are two ways to do this:

    1. Use the –namespace flag when creating the resource, like this:

    1. Specify a namespace in the YAML specification of the resource. Here is what it looks like in a pod specification:

    Important notes:

    • Note that if your YAML specification specifies one namespace, but the apply command specifies another namespace, the command will fail.

    • If you try to work with a Kubernetes resource in a different namespace, kubectl will not find the resource. Us the –namespace flag to work with resources in other namespaces, like this:

    hashtag
    What Are Kubernetes Nodes?

    A Kubernetesarrow-up-right node is a worker machine that runs Kubernetes workloadsarrow-up-right. It can be a physical (bare metal) machine or a virtual machine (VM). Each node can host one or more pods. Kubernetes nodes are managed by a control plane, which automatically handles the deployment and scheduling of pods across nodes in a Kubernetes cluster. When scheduling pods, the control plane assesses the resources available on each node.

    Each node runs two main components—a kubelet and a container runtime. The kubelet is in charge of facilitating communication between the control plane and the node. The container runtime is in charge of pulling the relevant container image from a registry, unpacking containers, running them on the node, and communicating with the operating system kernel.

    In this article:

    • Kubernetes Node Componentsarrow-up-right

    • Working with Kubernetes Nodes: 4 Basic Operationsarrow-up-right

    • Kubernetes Node Securityarrow-up-right

    hashtag
    Kubernetes Node Components

    Here are three main Kubernetes node components:

    kubelet

    The Kubelet is responsible for managing the deployment of pods to Kubernetes nodes. It receives commands from the API server and instructs the container runtime to start or stop containers as needed.

    kube-proxy

    A network proxy running on each Kubernetes node. It is responsible for maintaining network rules on each node. Network rules enable network communication between nodes and pods. Kube-proxy can directly forward traffic or use the operating system packet filter layer.

    Container runtime

    The software layer responsible for running containers. There are several container runtimes supported by Kubernetes, including Containerd, CRI-O, Docker, and other Kubernetes Container Runtime Interface (CRI) implementations.

    hashtag
    Working with Kubernetes Nodes: 4 Basic Operations

    Here is how to perform common operations on a Kubernetes node.

    1. Adding Node to a Cluster

    You can manually add nodes to a Kubernetes cluster, or let the kubelet on that node self-register to the control plane. Once a node object is created manually or by the kubelet, the control plane validates the new node object.

    Adding nodes automatically

    The example below is a JSON manifest that creates a node object. Kubernetes then checks that the kubelet registered to the API server matches the node’s metadata.name field. Only healthy nodes running all necessary services are eligible to run the pod. If the check fails, the node is ignored until it becomes healthy.

    Defining node capacity

    Nodes that self-register with the API Server report their CPU and memory volume capacity after the node object is created. However, When manually creating the node, administrators need to set up capacity demands. Once this information is defined, the Kubernetes scheduler assigns resources to all pods running on a node. The scheduler is responsible for ensuring that requests do not exceed node capacity.

    2. Modifying Node Objects

    You can use kubectl to manually create or modify node objects, overriding the settings defined in --register-node. You can, for example:

    • Use labels on nodes and node selectors to control scheduling. You can, for example, limit a pod to be eligible only for running on a subset of available nodes.

    • Mark a node as unschedulable to prevent the scheduler from adding new pods to the node. This action does not affect pods running on the node. You can use this option in preparation for maintenance tasks like node reboot. To mark the node as unschedulable, you can run: kubectl cordon $NODENAME.

    3. Checking Node Status

    There are three primary commands you can use to determine the status of a node and the resources running on it.

    kubectl describe nodes

    Run the command kubectl describe nodes my-node to get node information including:

    • HostName—reported by the node operating system kernel. You can report a different value for HostName using the kubelet flag --hostname-override.

    • InternalIP—enables traffic to be routed to the node within the cluster.

    • ExternalID—an IP that can be used to access the node from outside the cluster.

    • Conditions—system resource issues including CPU and memory utilization. This section shows error conditions like OutOfDisk, MemoryPressure, and DiskPressure.

    • Events—this section shows issues occurring in the environment, such as eviction of pods.

    kubectl describe pods

    You can use this command to get information about pods running on a node:

    • Pod information—labels, resource requirements, and containers running in the pod

    • Pod ready state—if a pod appears as READY, it means it passed the last readiness check.

    • Container state—can be Waiting, Running, or Terminated.

    • Restart count—how often a container has been restarted.

    • Log events—showing activity on the pod, indicating which component logged the event, for which object, a Reason and a Message explaining what happened.

    4. Understanding the Node Controller

    The node controller is the control plane component responsible for managing several aspects of the node’s lifecycle. Here are the three main roles of the node controller:

    Assigning CIDR addresses

    When the node is registered, the node controller assigns a Cross Inter-Domain Routing (CIDR) block (if CIDR assignment is enabled).

    Updating internal node lists

    The node controller maintains an internal list of nodes. It needs to be updated constantly with the list of machines available by the cloud provider. This list enables the node controller to ensure capacity is met.

    When a node is unhealthy, the node controller checks if the host machine for that node is available. If the VM is not available, the node controller deletes the node from the internal list. If Kubernetes is running on a public or private cloud, the node controller can send a request to create a new node, to maintain cluster capacity.

    Monitoring the health of nodes

    Here are several tasks the node controller is responsible for:

    • Checking the state of all nodes periodically, with the period determined by the --node-monitor-period flag.

    • Updating the NodeReady condition to ConditionUnknown if the node becomes unreachable and the node controller no longer receives heartbeats.

    • Evicting all pods from the node. If the node remains unreachable, the node controller uses graceful termination to evict the pods. Timeouts are set by default to 40 seconds, before reporting ConditionUnknown. Five minutes later, the node controller starts evicting pods.

    hashtag
    Kubernetes Node Security

    kubelet

    This component is the main node agent for managing individual containers that run in a pod. Vulnerabilities associated with the kubelet are constantly discovered, meaning that you need to regularly upgrade the kubelet versions and apply the latest patches. Access to the kubelet is not authenticated by default, so you should implement strong authentication measures to restrict access.

    kube-proxy

    This component handles request forwarding according to network rules. It is a network proxy that supports various protocols (i.e. TCP, UDP) and allows Kubernetes services to be exposed. There are two ways to secure kube-proxy:

    • If proxy configuration is maintained via the kubeconfig file, restrict file permissions to ensure unauthorized parties cannot tamper with proxy settings.

    • Ensure that communication with the API server is only done over a secured port, and always require authentication and authorization.

    Hardened Node Security

    You can harden your noder security by following these steps:

    • Ensure the host is properly configured and secure—check your configuration to ensure it meets the CIS Benchmarks standards.

    • Control access to sensitive ports—ensure the network blocks access to ports that kubelet uses. Limit Kubernetes API server access to trusted networks.

    • Limit administrative access to nodes—ensure your Kubernetes nodes have restricted access. You can handle tasks like debugging and without having direct access to a node.

    Isolation of Sensitive Workloads

    You should run any sensitive workload on dedicated machines to minimize the impact of a breach. Isolating workloads prevents an attacker from accessing sensitive applications through lower-priority applications on the same host or with the same container runtime. Attackers can only exploit the kubelet credentials of compromised nodes to access secrets that are mounted on those nodes. You can use controls such as node pools, namespaces, tolerations and taints to isolate your workloads.

    hashtag
    Taints and Tolerations

    Node affinityarrow-up-right is a property of Podsarrow-up-right that attracts them to a set of nodesarrow-up-right (either as a preference or a hard requirement). Taints are the opposite -- they allow a node to repel a set of pods.

    Tolerations are applied to pods. Tolerations allow the scheduler to schedule pods with matching taints. Tolerations allow scheduling but don't guarantee scheduling: the scheduler also evaluates other parametersarrow-up-right as part of its function.

    Taints and tolerations work together to ensure that pods are not scheduled onto inappropriate nodes. One or more taints are applied to a node; this marks that the node should not accept any pods that do not tolerate the taints.

    hashtag
    Concepts

    You add a taint to a node using kubectl taintarrow-up-right. For example,

    places a taint on node node1. The taint has key key1, value value1, and taint effect NoSchedule. This means that no pod will be able to schedule onto node1 unless it has a matching toleration.

    To remove the taint added by the command above, you can run:

    You specify a toleration for a pod in the PodSpec. Both of the following tolerations "match" the taint created by the kubectl taint line above, and thus a pod with either toleration would be able to schedule onto node1:

    Here's an example of a pod that uses tolerations:

    pods/pod-with-toleration.yamlarrow-up-right

    The default value for operator is Equal.

    A toleration "matches" a taint if the keys are the same and the effects are the same, and:

    • the operator is Exists (in which case no value should be specified), or

    • the operator is Equal and the values are equal.

    Note:

    There are two special cases:

    An empty key with operator Exists matches all keys, values and effects which means this will tolerate everything.

    An empty effect matches all effects with key key1.

    The above example used effect of NoSchedule. Alternatively, you can use effect of PreferNoSchedule. This is a "preference" or "soft" version of NoSchedule -- the system will try to avoid placing a pod that does not tolerate the taint on the node, but it is not required. The third kind of effect is NoExecute, described later.

    You can put multiple taints on the same node and multiple tolerations on the same pod. The way Kubernetes processes multiple taints and tolerations is like a filter: start with all of a node's taints, then ignore the ones for which the pod has a matching toleration; the remaining un-ignored taints have the indicated effects on the pod. In particular,

    • if there is at least one un-ignored taint with effect NoSchedule then Kubernetes will not schedule the pod onto that node

    • if there is no un-ignored taint with effect NoSchedule but there is at least one un-ignored taint with effect PreferNoSchedule then Kubernetes will try to not schedule the pod onto the node

    • if there is at least one un-ignored taint with effect NoExecute then the pod will be evicted from the node (if it is already running on the node), and will not be scheduled onto the node (if it is not yet running on the node).

    For example, imagine you taint a node like this

    And a pod has two tolerations:

    In this case, the pod will not be able to schedule onto the node, because there is no toleration matching the third taint. But it will be able to continue running if it is already running on the node when the taint is added, because the third taint is the only one of the three that is not tolerated by the pod.

    Normally, if a taint with effect NoExecute is added to a node, then any pods that do not tolerate the taint will be evicted immediately, and pods that do tolerate the taint will never be evicted. However, a toleration with NoExecute effect can specify an optional tolerationSeconds field that dictates how long the pod will stay bound to the node after the taint is added. For example,

    means that if this pod is running and a matching taint is added to the node, then the pod will stay bound to the node for 3600 seconds, and then be evicted. If the taint is removed before that time, the pod will not be evicted.

    hashtag
    Example Use Cases

    Taints and tolerations are a flexible way to steer pods away from nodes or evict pods that shouldn't be running. A few of the use cases are

    • Dedicated Nodes: If you want to dedicate a set of nodes for exclusive use by a particular set of users, you can add a taint to those nodes (say, kubectl taint nodes nodename dedicated=groupName:NoSchedule) and then add a corresponding toleration to their pods (this would be done most easily by writing a custom admission controllerarrow-up-right). The pods with the tolerations will then be allowed to use the tainted (dedicated) nodes as well as any other nodes in the cluster. If you want to dedicate the nodes to them and ensure they only use the dedicated nodes, then you should additionally add a label similar to the taint to the same set of nodes (e.g. dedicated=groupName), and the admission controller should additionally add a node affinity to require that the pods can only schedule onto nodes labeled with dedicated=groupName.

    • Nodes with Special Hardware: In a cluster where a small subset of nodes have specialized hardware (for example GPUs), it is desirable to keep pods that don't need the specialized hardware off of those nodes, thus leaving room for later-arriving pods that do need the specialized hardware. This can be done by tainting the nodes that have the specialized hardware (e.g. kubectl taint nodes nodename special=true:NoSchedule or kubectl taint nodes nodename special=true:PreferNoSchedule) and adding a corresponding toleration to pods that use the special hardware. As in the dedicated nodes use case, it is probably easiest to apply the tolerations using a custom . For example, it is recommended to use to represent the special hardware, taint your special hardware nodes with the extended resource name and run the admission controller. Now, because the nodes are tainted, no pods without the toleration will schedule on them. But when you submit a pod that requests the extended resource, the ExtendedResourceToleration admission controller will automatically add the correct toleration to the pod and that pod will schedule on the special hardware nodes. This will make sure that these special hardware nodes are dedicated for pods requesting such hardware and you don't have to manually add tolerations to your pods.

    • Taint based Evictions: A per-pod-configurable eviction behavior when there are node problems, which is described in the next section.

    hashtag
    Taint based Evictions

    FEATURE STATE: Kubernetes v1.18 [stable]

    The NoExecute taint effect, mentioned above, affects pods that are already running on the node as follows

    • pods that do not tolerate the taint are evicted immediately

    • pods that tolerate the taint without specifying tolerationSeconds in their toleration specification remain bound forever

    • pods that tolerate the taint with a specified tolerationSeconds remain bound for the specified amount of time

    The node controller automatically taints a Node when certain conditions are true. The following taints are built in:

    • node.kubernetes.io/not-ready: Node is not ready. This corresponds to the NodeCondition Ready being "False".

    • node.kubernetes.io/unreachable: Node is unreachable from the node controller. This corresponds to the NodeCondition Ready being "Unknown".

    • node.kubernetes.io/memory-pressure: Node has memory pressure.

    • node.kubernetes.io/disk-pressure: Node has disk pressure.

    • node.kubernetes.io/pid-pressure: Node has PID pressure.

    • node.kubernetes.io/network-unavailable: Node's network is unavailable.

    • node.kubernetes.io/unschedulable: Node is unschedulable.

    • node.cloudprovider.kubernetes.io/uninitialized: When the kubelet is started with "external" cloud provider, this taint is set on a node to mark it as unusable. After a controller from the cloud-controller-manager initializes this node, the kubelet removes this taint.

    In case a node is to be evicted, the node controller or the kubelet adds relevant taints with NoExecute effect. If the fault condition returns to normal the kubelet or node controller can remove the relevant taint(s).

    In some cases when the node is unreachable, the API server is unable to communicate with the kubelet on the node. The decision to delete the pods cannot be communicated to the kubelet until communication with the API server is re-established. In the meantime, the pods that are scheduled for deletion may continue to run on the partitioned node.

    Note: The control plane limits the rate of adding node new taints to nodes. This rate limiting manages the number of evictions that are triggered when many nodes become unreachable at once (for example: if there is a network disruption).

    You can specify tolerationSeconds for a Pod to define how long that Pod stays bound to a failing or unresponsive Node.

    For example, you might want to keep an application with a lot of local state bound to node for a long time in the event of network partition, hoping that the partition will recover and thus the pod eviction can be avoided. The toleration you set for that Pod might look like:

    Note:

    Kubernetes automatically adds a toleration for node.kubernetes.io/not-ready and node.kubernetes.io/unreachable with tolerationSeconds=300, unless you, or a controller, set those tolerations explicitly.

    These automatically-added tolerations mean that Pods remain bound to Nodes for 5 minutes after one of these problems is detected.

    DaemonSetarrow-up-right pods are created with NoExecute tolerations for the following taints with no tolerationSeconds:

    • node.kubernetes.io/unreachable

    • node.kubernetes.io/not-ready

    This ensures that DaemonSet pods are never evicted due to these problems.

    hashtag
    Taint Nodes by Condition

    The control plane, using the node controllerarrow-up-right, automatically creates taints with a NoSchedule effect for node conditionsarrow-up-right.

    The scheduler checks taints, not node conditions, when it makes scheduling decisions. This ensures that node conditions don't directly affect scheduling. For example, if the DiskPressure node condition is active, the control plane adds the node.kubernetes.io/disk-pressure taint and does not schedule new pods onto the affected node. If the MemoryPressure node condition is active, the control plane adds the node.kubernetes.io/memory-pressure taint.

    You can ignore node conditions for newly created pods by adding the corresponding Pod tolerations. The control plane also adds the node.kubernetes.io/memory-pressure toleration on pods that have a QoS classarrow-up-right other than BestEffort. This is because Kubernetes treats pods in the Guaranteed or Burstable QoS classes (even pods with no memory request set) as if they are able to cope with memory pressure, while new BestEffort pods are not scheduled onto the affected node.

    The DaemonSet controller automatically adds the following NoSchedule tolerations to all daemons, to prevent DaemonSets from breaking.

    • node.kubernetes.io/memory-pressure

    • node.kubernetes.io/disk-pressure

    • node.kubernetes.io/pid-pressure (1.14 or later)

    • node.kubernetes.io/unschedulable (1.10 or later)

    • node.kubernetes.io/network-unavailable (host network only)

    Adding these tolerations ensures backward compatibility. You can also add arbitrary tolerations to DaemonSets.

    Kubernetes Nodes need occasional maintenance. You could be updating the Node’s kernel, resizing its compute resource in your cloud account, or replacing physical hardware components in a self-hosted installation.

    Kubernetes cordons and drains are two mechanisms you can use to safely prepare for Node downtime. They allow workloads running on a target Node to be rescheduled onto other ones. You can then shutdown the Node or remove it from your cluster without impacting service availability.

    hashtag
    Applying a Node Cordon

    Cordoning a Node marks it as unavailable to the Kubernetes scheduler. The Node will be ineligible to host any new Pods subsequently added to your cluster.

    Use the kubectl cordon command to place a cordon around a named Node:

    Existing Pods already running on the Node won’t be affected by the cordon. They’ll remain accessible and will still be hosted by the cordoned Node.

    You can check which of your Nodes are currently cordoned with the get nodes command:

    Cordoned nodes appear with the SchedulingDisabled status.

    hashtag
    Draining a Node

    The next step is to drain remaining Pods out of the Node. This procedure will evict the Pods so they’re rescheduled onto other Nodes in your cluster. Pods are allowed to gracefully terminatearrow-up-right before they’re forcefully removed from the target Node.

    Run kubectl drain to initiate a drain procedure. Specify the name of the Node you’re taking out for maintenance:

    The drain procedure first cordons the Node if you’ve not already placed one manually. It will then evict running Kubernetes workloads by safely rescheduling them to other Nodes in your cluster.

    You can shutdown or destroy the Node once the drain’s completed. You’ve freed the Node from its responsibilities to your cluster. The cordon provides an assurance that no new workloads have been scheduled since the drain completed.

    hashtag
    Ignoring Pod Grace Periods

    Drains can sometimes take a while to complete if your Pods have long grace periods. This might not be ideal when you need to urgently take a Node offline. Use the --grace-period flag to override Pod termination grace periods and force an immediate eviction:

    This should be used with care – some workloads might not respond well if they’re stopped without being offered a chance to clean up.

    hashtag
    Understanding the pod phase

    Pod Phase

    Description

    Pending

    After you create the Pod object, this is its initial phase. Until the pod is scheduled to a node and the images of its containers are pulled and started, it remains in this phase.

    Running

    At least one of the pod’s containers is running.

    Succeeded

    Pods that aren’t intended to run indefinitely are marked as Succeeded when all their containers complete successfully.

    Failed

    When a pod is not configured to run indefinitely and at least one of its containers terminates unsuccessfully, the pod is marked as Failed.

    Unknown

    The state of the pod is unknown because the Kubelet has stopped reporting communicating with the API server. Possibly the worker node has failed or has disconnected from the network.

    hashtag
    pod’s conditions during its lifecycle

    Pod Condition

    Description

    PodScheduled

    Indicates whether or not the pod has been scheduled to a node.

    Initialized

    The pod’s init containers have all completed successfully.

    ContainersReady

    All containers in the pod indicate that they are ready. This is a necessary but not sufficient condition for the entire pod to be ready.

    Ready

    The pod is ready to provide services to its clients. The containers in the pod and the pod’s readiness gates are all reporting that they are ready. Note: this is explained in chapter 10.

    Understanding the container state

    Container State

    Description

    Waiting

    The container is waiting to be started. The reason and message fields indicate why the container is in this state.

    Running

    The container has been created and processes are running in it. The startedAt field indicates the time at which this container was started.

    Terminated

    The processes that had been running in the container have terminated. The startedAt and finishedAt fields indicate when the container was started and when it terminated. The exit code with which the main process terminated is in the exitCode field.

    Unknown

    The state of the container couldn’t be determined.

    Configuring the pod’s restart policy

    Restart Policy

    Description

    Always

    Container is restarted regardless of the exit code the process in the container terminates with. This is the default restart policy.

    OnFailure

    The container is restarted only if the process terminates with a non-zero exit code, which by convention indicates failure.

    Never

    The container is never restarted - not even when it fails.

    hashtag
    What are the Three Types of Kubernetes Probes?

    Kubernetes provides the following types of probes. For all these types, if the container does not implement the probe handler, their result is always Success.

    • Liveness Probe—indicates if the container is operating. If so, no action is taken. If not, the kubelet kills and restarts the container. Learn more in our guide to Kubernetes liveness probesarrow-up-right.

    • Readiness Probe—indicates whether the application running in the container is ready to accept requests. If so, Services matching the pod are allowed to send traffic to it. If not, the endpoints controller removes the pod from all matching Kubernetes Services.

    • Startup Probe—indicates whether the application running in the container has started. If so, other probes start functioning. If not, the kubelet kills and restarts the container.

    hashtag
    When to Use Readiness Probes

    Readiness probes are most useful when an application is temporarily malfunctioning and unable to serve traffic. If the application is running but not fully available, Kubernetes may not be able to scale it up and new deployments could fail. A readiness probe allows Kubernetes to wait until the service is active before sending it traffic.

    When you use a readiness probe, keep in mind that Kubernetes will only send traffic to the pod if the probe succeeds.

    There is no need to use a readiness probe on deletion of a pod. When a pod is deleted, it automatically puts itself into an unready state, regardless of whether readiness probes are used. It remains in this status until all containers in the pod have stopped.

    hashtag
    How Readiness Probes Work in Kubernetes

    A readiness probe can be deployed as part of several Kubernetes objects. For example, here is how to define a readiness probe in a Deployment:

    Once the above Deployment object is applied to the cluster, the readiness probe runs continuously throughout the lifecycle of the application.

    A readiness probe has the following configuration options:

    PARAMETER
    DESCRIPTION
    DEFAULT VALUE

    initialDelaySeconds

    Number of seconds between container start and probe start to allow for services to initialize.

    0

    periodSeconds

    Frequency of readiness test.

    10

    timeoutSeconds

    Timeout for probe responses.

    1

    hashtag
    Why Do Readiness Probes Fail? Common Error Scenarios

    Readiness probes are used to verify tasks during a container lifecycle. This means that if the probe’s response is interrupted or delayed, service may be interrupted. Keep in mind that if a readiness probe returns Failure status, Kubernetes will remove the pod from all matching service endpoints. Here are two examples of conditions that can cause an application to incorrectly fail the readiness probe.

    hashtag
    Delayed Response

    In some circumstances, readiness probes may be late to respond—for example, if the application needs to read large amounts of data with low latency or perform heavy computations. Consider this behavior when configuring readiness probes, and always test your application thoroughly before running it in production with a readiness probe.

    hashtag
    Cascading Failures

    A readiness probe response can be conditional on components that are outside the direct control of the application. For example, you could configure a readiness probe using HTTPGet, in such a way that the application first checks the availability of a cache service or database before responding to the probe. This means that if the database is down or late to respond, the entire application will become unavailable.

    This may or may not make sense, depending on your application setup. If the application cannot function at all without the third-party component, maybe this behavior is warranted. If it can continue functioning, for example, by falling back to a local cache, the database or external cache should not be connected to probe responses.

    In general, if the pod is technically ready, even if it cannot function perfectly, it should not fail the readiness probe. A good compromise is to implement a “degraded mode,” for example, if there is no access to the database, answer read requests that can be addressed by local cache and return 503 (service unavailable) on write requests. Ensure that downstream services are resilient to a failure in the upstream service.

    hashtag
    Methods of Checking Application Health

    Startup, readiness, and liveness probes can check the health of applications in three ways: HTTP checks, container execution checks, and TCP socket checks.

    hashtag
    HTTP Checks

    An HTTP check is ideal for applications that return HTTP status codes, such as REST APIs.

    HTTP probe uses GET requests to check the health of an application. The check is successful if the HTTP response code is in the range 200-399.

    The following example demonstrates how to implement a readiness probe with the HTTP check method:

    1. The readiness probe endpoint.

    2. How long to wait after the container starts before checking its health.

    3. How long to wait for the probe to finish.

    hashtag
    Container Execution Checks

    Container execution checks are ideal in scenarios where you must determine the status of the container based on the exit code of a process or shell script running in the container.

    When using container execution checks Kubernetes executes a command inside the container. Exiting the check with a status of 0 is considered a success. All other status codes are considered a failure.

    The following example demonstrates how to implement a container execution check:

    1. The command to run and its arguments, as a YAML array.

    hashtag
    TCP Socket Checks

    A TCP socket check is ideal for applications that run as daemons, and open TCP ports, such as database servers, file servers, web servers, and application servers.

    When using TCP socket checks Kubernetes attempts to open a socket to the container. The container is considered healthy if the check can establish a successful connection.

    The following example demonstrates how to implement a liveness probe by using the TCP socket check method:

    1. The TCP port to check.

    hashtag
    Creating Probes

    To configure probes on a deployment, edit the deployment’s resource definition. To do this, you can use the kubectl edit or kubectl patch commands. Alternatively, if you already have a deployment YAML definition, you can modify it to include the probes and then apply it with kubectl apply.

    The following example demonstrates using the kubectl edit command to add a readiness probe to a deployment:

    Note

    This will open your system’s default editor with the deployment definition. Once you make the necessary changes, save and quit the editor to apply them.

    The following examples demonstrate using the kubectl set probe command with a variety of options:

    hashtag
    Assign Pods to Nodes using Node Affinity

    This page shows how to assign a Kubernetes Pod to a particular node using Node Affinity in a Kubernetes cluster.

    hashtag
    Before you begin

    You need to have a Kubernetes cluster, and the kubectl command-line tool must be configured to communicate with your cluster. It is recommended to run this tutorial on a cluster with at least two nodes that are not acting as control plane hosts. If you do not already have a cluster, you can create one by using minikubearrow-up-right or you can use one of these Kubernetes playgrounds:

    • Killercodaarrow-up-right

    • Play with Kubernetesarrow-up-right

    Your Kubernetes server must be at or later than version v1.10. To check the version, enter kubectl version.

    hashtag
    Add a label to a node

    1. List the nodes in your cluster, along with their labels:

      The output is similar to this:

    2. Choose one of your nodes, and add a label to it:

      where <your-node-name> is the name of your chosen node.

    3. Verify that your chosen node has a disktype=ssd label:

      The output is similar to this:

      In the preceding output, you can see that the worker0 node has a disktype=ssd label.

    hashtag
    Schedule a Pod using required node affinity

    This manifest describes a Pod that has a requiredDuringSchedulingIgnoredDuringExecution node affinity,disktype: ssd. This means that the pod will get scheduled only on a node that has a disktype=ssd label.

    pods/pod-nginx-required-affinity.yamlarrow-up-right

    1. Apply the manifest to create a Pod that is scheduled onto your chosen node:

    2. Verify that the pod is running on your chosen node:

      The output is similar to this:

    hashtag
    Schedule a Pod using preferred node affinity

    This manifest describes a Pod that has a preferredDuringSchedulingIgnoredDuringExecution node affinity,disktype: ssd. This means that the pod will prefer a node that has a disktype=ssd label.

    pods/pod-nginx-preferred-affinity.yamlarrow-up-right

    1. Apply the manifest to create a Pod that is scheduled onto your chosen node:

    2. Verify that the pod is running on your chosen node:

      The output is similar to this:

    Kubernetesarrow-up-right
    Kubernetes networkingarrow-up-right
    Service
    Cost

    1

    OVH CLoud

    Advance-6 Gen 2 Server

    306.67 $ / month

    2

    OVH CLoud

    6 Public IP

    12 $ /month

    3

    AWS

    S3 / SES / Route 53

    20 ~ 30 USD

    circle-check

    One time payment : Implementaion DevOps full CI/CD pipeline

    ID
    Provider

    1

    Omar Abdalhamid

    750 $

    AWS RDS

    Amazon Relational Database Service (Amazon RDS) makes it easy to set up, operate and scale relational databases in the cloud. It provides cost-efficient and resizable capabilities while automating time-consuming administration tasks such as hardware provisioning, database setup, patching, and backup. It frees you up to focus on your applications so that you can provide them with the fast performance, high availability, security and compatibility they need.

    Amazon RDS is available on multiple database instance types - optimized for memory, performance or I/O - and gives you six familiar database engines to choose from, including Amazon Aurora, PostgreSQL, MySQL, MariaDB, Oracle Database and SQL Server Huh. You can use the AWS Database Migration Service to migrate easily or replicate your existing databases to Amazon RDS.

    hashtag
    How it works

    Amazon Relational Database Service (Amazon RDS) is a collection of managed services that makes it simple to set up, operate, and scale databases in the cloud. Choose from seven popular engines — , , , , , , and — and deploy on-premises with .

    Databases store large amounts of data that applications can draw upon to help them perform various tasks. A relational database uses tables to store data and is called relational because it organizes data points with defined relationships.

    Administrators control Amazon RDS with the AWS Management Console, Amazon RDS API calls, or the AWS command-line interface. They use these interfaces to deploy database instances to which users can apply specific settings.

    Amazon provides several instance types with different resources, such as CPU, memory, storage options, and networking capability. Each type comes in a variety of sizes to suit the needs of different workloads.

    RDS users can use AWS Identity and Access Management to define and set permissions to access RDS databases.

    hashtag
    Amazon RDS Features

    Amazon RDS features include the following:

    Replication. RDS uses the replication feature to create read replicas, and these are read-only copies of the database instances that the application uses without changing the original production database. Administrators can also enable automatic failover across multiple availability zones through RDS multi-edge deployment and synchronous data replication.

    hashtag
    Amazon RDS - DB Instances

    A DB instance is an isolated database environment running in the cloud which can contain multiple user-created databases. It can be accessed using the same client tools and applications used to access a standalone database instance. But there is restriction on how many DB instances of what type you can have for a single customer account. The below diagram illustrates the different combinations based on the type of license you opt for.

    Each DB instance is identified by a customer supplied name called DB instance identifier. It is unique for the customer for a given AWS region.

    hashtag
    DB Instance Classes

    Depending on the need of the processing power and memory requirement, there is a variety of instance classes offered by AWS for the RDS service.

    Instance Class
    Number of Vcpu
    Memory Range in GB
    Bandwidth Range in Mbps

    When there is a need of more processing power than memory requirement you can choose the standard instance class with a higher number of virtual CPUs. But in the case of very high memory requirement you can choose Memory optimized class with appropriate number of VCPUs. Choosing a correct class not only impacts the speed of the processing but also the cost of using service. The burstable performance class is needed when you have a minimal processing requirement and the data size in not in peta bytes.

    hashtag
    DB Instance Status

    The DB Instance status indicates the health of the DB. It’s value can be seen from the AWS console or using AWS CLI command describe-db-instances. The important status values of DB instances and their meaning is described below.

    DB Instance Status
    Meaning
    Is the Instance Billed?

    hashtag
    Amazon RDS - DB Storages

    The RDS instances use Amazon Block Storage (EBS) volumes for storing data and log. These storage types can dynamically increase their size as and when needed. But based on the database workloads and price associated with these storage types we can customize the storage need. Following are the factors to be analysed while deciding on the storage types.

    • IOPS – It represents the number of Input Output operations performed per second. Both read and write operations are summed up for finding the IOPS value. AWS creates a report of IOPS value for every 1 minute. It can have value from 0 to tens of thousands per second.

    • Latency – It is the number of milliseconds elapsed between the initiation of an I/O request and the completion of the I/O request. A bigger latency indicates a slower performance.

    • Throughput – The number of bytes transferred to and from the disk every second. AWS reports the read and write throughput separately for every 1-minute interval.

    Based on the above considerations, the aws storage types are as below.

    hashtag
    General Purpose SSD

    This is a cost-effective storage that is useful in most of the common database tasks. It can provide 3000 IOPS for a 1- TiB volume. In a 3.34 TiB size the performance can go up to 10000 IOPS.

    hashtag
    I/O Credits

    Each GB of storage allows 3 IOPs as a base line performance. Which mean a 100 GB volume can provide 300 IOPs. But there may be scenario when you need more IOPS. In such scenario you need to use some IO credit balance which is offered when the storage is initialized. It is 5.4 million IO credits which can be used when a burstable performance need arises. On the other hand when you use less IOPS than the baseline performance, you accumulate the credits which can be used in future requirement of burstable performances.

    Below is a equation which shows the relation between burst duration and Credit balance.

    If your DB needs frequent and long duration burstable performance, then the next storage type will be a better choice.

    hashtag
    Provisioned IOPS Storage

    This is a type of storage system that gives sustained higher performance and consistently low latency which is most suitable for OLTP workloads.

    When creating the DB instance, you specify the required IOPS rate and volume size for such storage. Below is a chart which is used for reference for deciding about the IOPS and storage needed under provisioned storage.

    DB Engine
    Provisioned IOPS Range
    Storage Range

    This is a very old storage technology which is maintained by aws, only for backward compatibility. Its features are very limited which are the following.

    • Does not support Elastic Volumes

    • Limited to maximum size of 4 TB

    • Limited to maximum of 1000 IOPS

    Amazon RDS for MySQL

    MySQL is the world's most popular open source relational database and Amazon RDS makes it easy to set up, operate, and scale MySQL deployments in the cloud. With Amazon RDS, you can deploy scalable MySQL servers in minutes with cost-efficient and resizable hardware capacity.

    Amazon RDS for MySQL frees you up to focus on application development by managing time-consuming database administration tasks, including backups, upgrades, software patching, performance improvements, monitoring, scaling, and replication.

    Amazon RDS supports MySQL Community Edition versions 5.7 and 8.0 which means that the code, applications, and tools you already use today can be used with Amazon RDS.

    hashtag
    Easy, managed deployments

    It takes only a few clicks in the Amazon Web Services Management Console to launch and connect to a production-ready MySQL database in minutes. Amazon RDS for MySQL database instances are pre-configured with parameters and settings for the server type you have selected. Database parameter groups provide granular control and fine-tuning of your MySQL database. When you need to make a database update, Amazon RDS Blue/Green Deployments are designed to make them safer, simpler, and faster.

    hashtag
    Fast, predictable storage

    Amazon RDS provides two SSD-backed storage options for your MySQL database. General Purpose storage provides cost-effective storage for small or medium-sized workloads. For high-performance OLTP applications, Provisioned IOPS delivers consistent performance of up to 80,000 IOs per second. As your storage requirements grow you can provision additional storage on-the-fly with zero downtime. With you can achieve up to 2x improved write transaction throughput.

    hashtag
    Backup and recovery

    The automated backup feature of Amazon RDS enables recovery of your MySQL database instance to any point in time within your specified retention period of up to thirty five days. In addition, you can perform user-initiated backups of your DB Instance. These full database backups will be stored by Amazon RDS until you explicitly delete them.

    hashtag
    High availability and read replicas

    Amazon RDS Multi-AZ deployments provide enhanced availability and durability for your MySQL databases, making them a natural fit for production database workloads. Amazon RDS Read Replicas make it easy to elastically scale out beyond the capacity constraints of a single database instance for read-heavy database workloads.

    hashtag
    Monitoring and metrics

    Amazon RDS provides metrics for your database instances at no additional charge and Amazon RDS Enhanced Monitoring provides access to over 50 CPU, memory, file system, and disk I/O metrics. View key operational metrics in Amazon Web Services Management Console, including compute/memory/storage capacity utilization, I/O activity, and instance connections.

    hashtag
    Isolation and security

    As a managed service, Amazon RDS provides a high level of security for your MySQL databases. These include network isolation using , encryption at rest using keys you create and control through and encryption of data in transit using SSL.

    AWS Elastic Transcode

    hashtag
    What is Elastic Transcoder?

    • Elastic Transcoder is an aws service used to convert the media files stored in an S3 bucket into the media files in different formats supported by different devices.

    • Elastic Transcoder is a media transcoder in the cloud.

    • It is used to convert media files from their original source format into different formats that will play on smartphones, tablets, PC's, etc.

    • It provides transcoding presets for popular output formats means that you don't need to guess about which settings work best on particular devices.

    • If you use Elastic Transcoder, then you need to pay based on the minutes that you transcode and the resolution at which you transcode.

    hashtag
    Components of Elastic Transcoder

    Elastic Transcoder consists of four components:

    • Jobs

    • Pipelines

    • Presets

    • Jobs The main task of the job is to complete the work of transcoding. Each job can convert a file up to 30 formats. For example, if you want to convert a media file into eight different formats, then a single job creates files in eight formats. When you create a job, you need to specify the name of the file that you want to transcode.

    • Pipelines Pipelines are the queues that consist of your transcoding jobs. When you create a job, then you need to specify which pipeline you want to add your job. If you want a job to create more than one format, Elastic Transcoder creates the files for each format in the order you specify the formats in a job. You can create either of the two pipelines, i.e., standard-priority jobs and high-priority jobs. Mainly jobs go into the standard-priority jobs. Sometimes you want to transcode the file immediately; the high-priority pipeline is used.

    hashtag
    How A Cloud Uses Elastic Transcoder

    Suppose I uploaded the mp4 file in S3 bucket. As soon as uploading is completed, it triggers a Lambda function. Lambda function will then invoke Elastic Transcoder. Elastic Transcoder converts the mp4 file into different formats so that the file can be opened in iphone, Laptop, etc. Once it has completed the transcoding, it stores the transcoded files in S3 bucket.

    Amazon Aurora RDS

    MySQL and PostgreSQL-compatible relational database built for the cloud.

    Amazon Aurora is a MySQL and PostgreSQL-compatible relational database built for the cloud, that combines the performance and availability of traditional enterprise databases with the simplicity and cost-effectiveness of open source databases.

    Amazon Aurora is up to five times faster than standard MySQL databases and three times faster than standard PostgreSQL databases. Amazon Aurora is fully managed by Amazon Relational Database Service (RDS), which automates time-consuming administration tasks like hardware provisioning, database setup, patching, and backups.

    Amazon Aurora features a distributed, fault-tolerant, self-healing storage system that auto-scales up to 128TB per database instance. It delivers high performance and availability with up to 15 low-latency read replicas, point-in-time recovery, continuous backup to Amazon S3, and replication across three Availability Zones (AZs).

    Visit the Amazon RDS Management Consolearrow-up-right to create your first Aurora database instance and start migrating your MySQL and PostgreSQL databases.

    hashtag
    Benefits

    hashtag
    High Performance and Scalability

    Get 5X the throughput of standard MySQL and 3X the throughput of standard PostgreSQL. You can easily scale your database deployment up and down from smaller to larger instance types as your needs change, or let Aurora Serverless handle scaling automatically for you. To scale read capacity and performance, you can add up to 15 low latency read replicas across three Availability Zones. Amazon Aurora automatically grows storage as needed, up to 128TB per database instance.

    hashtag
    High Availability and Durability

    Amazon Aurora is designed to offer greater than 99.99% availability, replicating 6 copies of your data across 3 Availability Zones and backing up your data continuously to Amazon S3. It transparently recovers from physical storage failures; instance failover typically takes less than 30 seconds.

    hashtag
    Highly Secure

    Amazon Aurora provides multiple levels of security for your database. These include network isolation using ,encryption at rest using keys you create and control through and encryption of data in transit using SSL. On an encrypted Amazon Aurora instance, data in the underlying storage is encrypted, as are the automated backups, snapshots, and replicas in the same cluster.

    hashtag
    MySQL and PostgreSQL Compatible

    The Amazon Aurora database engine is fully compatible with existing MySQL and PostgreSQL open source databases, and adds compatibility for new releases regularly. This means you can easily migrate MySQL or PostgreSQL databases to Aurora using standard MySQL or PostgreSQL import/export tools or snapshots. It also means the code, applications, drivers, and tools you already use with your existing databases can be used with Amazon Aurora with little or no change.

    hashtag
    Fully Managed

    Amazon Aurora is fully managed by Amazon Relational Database Service (RDS). You no longer need to worry about database management tasks such as hardware provisioning, software patching, setup, configuration, or backups. Aurora automatically and continuously monitors and backs up your database to Amazon S3, enabling granular point-in-time recovery. You can monitor database performance using Amazon CloudWatch, Enhanced Monitoring, or Performance Insights, an easy-to-use tool that helps you quickly detect performance problems.

    hashtag
    Migration Support

    MySQL and PostgreSQL compatibility make Amazon Aurora a compelling target for database migrations to the cloud. If you're migrating from MySQL or PostgreSQL, see our for a list of tools and options. To migrate from commercial database engines, you can use the for a secure migration with minimal downtime.

    Amazon RDS - Event Notifications

    Throughout the life cycle of amazon RDS DB instances, many DB events occur which are important to be known beforehand. For example - A backup of the DB instance has started, or an error has occurred while restarting MySQL or MariaDB.

    hashtag
    Notification Categories

    Based on the nature of the event, notifications can be classified into following categories.

    Category
    Example

    hashtag
    Creating Event Notifications

    Below are the steps to create event subscriptions through which the notifications are sent to the subscriber.

    hashtag
    Step-1

    Choose the Event subscription tab from the RDS dashboard.

    hashtag
    Step-2

    We give a name to the event and choose the subscription source.

    Now choosing the source.

    hashtag
    Step-3

    In the next step we see the details of the source type of a subscription type chosen for the event.

    Amazon SQS

    hashtag
    Distributed queues

    There are three main parts in a distributed messaging system: the components of your distributed system, your queue (distributed on Amazon SQS servers), and the messages in the queue.

    In the following scenario, your system has several producers (components that send messages to the queue) and consumers (components that receive messages from the queue). The queue (which holds messages A through E) redundantly stores the messages across multiple Amazon SQS servers.

    hashtag
    Message lifecycle

    The following scenario describes the lifecycle of an Amazon SQS message in a queue, from creation to deletion.

    A producer (component 1) sends message A to a queue, and the message is distributed across the Amazon SQS servers redundantly.

    When a consumer (component 2) is ready to process messages, it consumes messages from the queue, and message A is returned. While message A is being processed, it remains in the queue and isn't returned to subsequent receive requests for the duration of the .

    The consumer (component 2) deletes message A from the queue to prevent the message from being received and processed again when the visibility timeout expires.

    Amazon SQS supports two types of queues – standard queues and FIFO queues. Use the information from the following table to chose the right queue for your situation. To learn more about Amazon SQS queues, see and .

    Standard queues
    FIFO queues

    Amazon RDS - DB Monitoring

    In order to maintain the reliability, availability, and performance of Amazon RDS, we need to collect monitoring data so that we can easily debug a multi-point failure. With Amazon RDS, you can monitor network throughput, I/O for read, write, and/or metadata operations, client connections, and burst credit balances for your DB instances. We should also consider storing historical monitoring data. This stored data will give you a baseline to compare against with current performance data.

    Below are examples of some monitoring data and how they help in maintaining healthy RDS instances.

    • High CPU or RAM consumption – High values for CPU or RAM consumption might be appropriate, provided that they are in keeping with your goals for your application (like throughput or concurrency) and are expected.

    Amazon RDS - Data Import / Export

    Amazon RDS MariaDB provides easy ways of importing data into the DB and exporting data from the DB. After we are able to successfully connect to the MariaDB database we can use CLI tools to run the import and export commands to get the data from other sources in and out of the RDS database.

    Below are the scenarios to consider when deciding on the approach to the import the data into the Amazon RDS- MariaDB database.

    hashtag
    From an Existing MariaDB database

    An existing MariaDB can be present on premise or in another EC2 instance. Diagrammatically what we do is shown below.

    Amazon RDS - DB Access Control

    To access the Amazon RDS DB instance the user needs specific permissions. This is configured using AWS IAM (Identity and Access management). In this tutorial we will see how this configuration is done.

    The configuration involves two parts.

    • Authentication

    • Access Control

    Amazon RDS Multi-AZ with one standby

    hashtag
    Amazon RDS Multi-AZ with one standby

    Automatic fail over
    Protect database performance
    Enhance durability
    Increase availability

    Amazon Aurora Serverless

    Amazon Aurora Serverless is an on-demand, autoscaling configuration for . It automatically starts up, shuts down, and scales capacity up or down based on your application's needs. You can run your database in the cloud without managing any database instances. You can also use Aurora Serverless v2 instances along with provisioned instances in your existing or new database clusters.

    Manually managing database capacity can take up valuable time and can lead to inefficient use of database resources. With Aurora Serverless, you create a database, specify the desired database capacity range, and connect your applications. You pay on a per-second basis for the database capacity that you use when the database is active, and migrate between standard and serverless configurations with a few steps in the Amazon Relational Database Service (Amazon RDS) console.

    Amazon Aurora Serverless v2 scales instantly to hundreds of thousands of transactions in a fraction of a second. As it scales, it adjusts capacity in fine-grained increments to provide the right amount of database resources that the application needs. There is no database capacity for you to manage. You pay only for the capacity your application consumes, and you can save up to 90% of your database cost compared to the cost of provisioning capacity for peak load.

    AWS RDS Automated Backup

    For Automated backup to work properly, followings are the criteria.

    • Your DB instance must be in the ACTIVE state for automated backups to occur. Automated backups don't occur while your DB instance is in a state other than ACTIVE, for example STORAGE_FULL.

    • Automated backups and automated snapshots don't occur while a copy is executing in the same region for the same DB instance.

    The first snapshot of a DB instance contains the data for the full DB instance. Subsequent snapshots of the same DB instance are incremental, which means that only the data that has changed after your most recent snapshot is saved.

    Kubernetes Architecture

    This comprehensive guide on Kubernetes architecture aims to explain each kubernetes component in detail with illustrations.

    So, If you want to,

    1. Understand kubernetes architecture

    2. Understand the workflow of Kubernetes core components

    kubectl get nodes --show-labels
    NAME      STATUS    ROLES    AGE     VERSION        LABELS
    worker0   Ready     <none>   1d      v1.13.0        ...,kubernetes.io/hostname=worker0
    worker1   Ready     <none>   1d      v1.13.0        ...,kubernetes.io/hostname=worker1
    worker2   Ready     <none>   1d      v1.13.0        ...,kubernetes.io/hostname=worker2
    kubectl label nodes <your-node-name> disktype=ssd
    kubectl apply -f https://k8s.io/examples/pods/pod-nginx-required-affinity.yaml
    kubectl get pods --output=wide
    NAME     READY     STATUS    RESTARTS   AGE    IP           NODE
    nginx    1/1       Running   0          13s    10.200.0.4   worker0
    kubectl apply -f https://k8s.io/examples/pods/pod-nginx-preferred-affinity.yaml
    kubectl get pods --output=wide
    NAME     READY     STATUS    RESTARTS   AGE    IP           NODE
    nginx    1/1       Running   0          13s    10.200.0.4   worker0
    kind: Namespace
    apiVersion: v1
    metadata:
      name: mynamespace
      labels:
        name: mynamespace
    kubectl apply -f test.yaml
    NAME             STATUS   AGE
    default          Active   3d
    kube-node-lease  Active   3d
    kube-public      Active   3d
    kube-system      Active   3d
    mynamespace      Active   1d
    apiVersion: v1
    kind: Pod
    metadata:
      name: mypod
      labels:
        name: mypod
    spec:
      containers:
     —name: mypod
        image: nginx
    kubectl apply -f pod.yaml --namespace=mynamespace
    apiVersion: v1
    kind: Pod
    metadata:
      name: mypod
      namespace: mynamespace
      labels:
        name: mypod
    ...
    kubectl get pods --namespace=mynamespace
    
    {
      "kind": "Node",
      "apiVersion": "v1",
      "metadata": {
        "name": "<node-ip-address>",
        "labels": {
          "name": "<node-logical-name>"
        }
      }
    }
    kubectl taint nodes node1 key1=value1:NoSchedule
    kubectl taint nodes node1 key1=value1:NoSchedule-
    tolerations:
    - key: "key1"
      operator: "Equal"
      value: "value1"
      effect: "NoSchedule"
    tolerations:
    - key: "key1"
      operator: "Exists"
      effect: "NoSchedule"
    apiVersion: v1
    kind: Pod
    metadata:
      name: nginx
      labels:
        env: test
    spec:
      containers:
      - name: nginx
        image: nginx
        imagePullPolicy: IfNotPresent
      tolerations:
      - key: "example-key"
        operator: "Exists"
        effect: "NoSchedule"
    kubectl taint nodes node1 key1=value1:NoSchedule
    kubectl taint nodes node1 key1=value1:NoExecute
    kubectl taint nodes node1 key2=value2:NoSchedule
    tolerations:
    - key: "key1"
      operator: "Equal"
      value: "value1"
      effect: "NoSchedule"
    - key: "key1"
      operator: "Equal"
      value: "value1"
      effect: "NoExecute"
    tolerations:
    - key: "key1"
      operator: "Equal"
      value: "value1"
      effect: "NoExecute"
      tolerationSeconds: 3600
    tolerations:
    - key: "node.kubernetes.io/unreachable"
      operator: "Exists"
      effect: "NoExecute"
      tolerationSeconds: 6000
    $ kubectl cordon node-1
    node/node-1 cordoned
    $ kubectl get nodes
    NAME       STATUS                     ROLES                  AGE   VERSION
    node-1     Ready,SchedulingDisabled   control-plane,master   26m   v1.23.3
    $ kubectl drain node-1
    node/node-1 already cordoned
    evicting pod kube-system/storage-provisioner
    evicting pod default/nginx-7c658794b9-zszdd
    evicting pod kube-system/coredns-64897985d-dp6lx
    pod/storage-provisioner evicted
    pod/nginx-7c658794b9-zszdd evicted
    pod/coredns-64897985d-dp6lx evicted
    node/node-1 evicted
    $ kubectl drain node-1 --grace-period 0
    ...contents omitted...
    readinessProbe:
      httpGet:
        path: /health (1)
        port: 8080
      initialDelaySeconds: 15 (2)
      timeoutSeconds: 1 (3)
    ...contents omitted...
    ...contents omitted...
    livenessProbe:
      exec:
        command:(1)
        - cat
        - /tmp/health
      initialDelaySeconds: 15
      timeoutSeconds: 1
    ...contents omitted...
    ...contents omitted...
    livenessProbe:
      tcpSocket:
        port: 8080 (1)
      initialDelaySeconds: 15
      timeoutSeconds: 1
    ...contents omitted...
    [user@host ~]$ kubectl set probe deployment myapp --readiness \
    --get-url=http://:8080/healthz --period=20
    [user@host ~]$ kubectl patch deployment myapp \
    -p '{"spec":{"containers"[0]: {"readinessProbe": {}}}}'
    [user@host ~]$ kubectl set probe deployment myapp --readiness \
    --get-url=http://:8080/healthz --period=20
    [user@host ~]$ kubectl set probe deployment myapp --liveness \
    --open-tcp=3306 --period=20 \
    --timeout-seconds=1
    [user@host ~]$ kubectl set probe deployment myapp --liveness \
    --get-url=http://:8080/healthz --initial-delay-seconds=30 \
    --success-threshold=1 --failure-threshold=3
    apiVersion: v1
    kind: Pod
    metadata:
      name: nginx
    spec:
      affinity:
        nodeAffinity:
          requiredDuringSchedulingIgnoredDuringExecution:
            nodeSelectorTerms:
            - matchExpressions:
              - key: disktype
                operator: In
                values:
                - ssd            
      containers:
      - name: nginx
        image: nginx
        imagePullPolicy: IfNotPresent
    apiVersion: v1
    kind: Pod
    metadata:
      name: nginx
    spec:
      affinity:
        nodeAffinity:
          preferredDuringSchedulingIgnoredDuringExecution:
          - weight: 1
            preference:
              matchExpressions:
              - key: disktype
                operator: In
                values:
                - ssd          
      containers:
      - name: nginx
        image: nginx
        imagePullPolicy: IfNotPresent
    Amazon RDS Optimized Writesarrow-up-right
    Amazon CloudWatcharrow-up-right
    Amazon Virtual Private Cloud (VPC)arrow-up-right
    Amazon Key Management Service (KMS)arrow-up-right
    Amazon VPCarrow-up-right
    Amazon Key Management Service (KMS)arrow-up-right
    migration documentationarrow-up-right
    Amazon Database Migration Servicearrow-up-right
    https://us.ovh.com/us/order/arrow-up-right
    Aurora Serverless v2 supports all manner of database workloads. Examples include development and test environments, websites, and applications that have infrequent, intermittent, or unpredictable workloads to the most demanding, business critical applications that require high scale and high availability. It supports the full breadth of Aurora features, including global database, Multi-AZ deployments, and read replicas. Aurora Serverless v2 is available for the Amazon Aurora MySQL-Compatible Edition and PostgreSQL-Compatible Edition.

    hashtag
    Benefits

    hashtag
    Highly scalable

    Scale instantly to hundreds of thousands of transactions in a fraction of a second.

    hashtag
    Highly available

    Power your business-critical workloads with the full breadth of Aurora features, including cloning, global database, Multi-AZ, and read replicas.

    hashtag
    Cost effective

    Scale out fine-grained increments to provide just the right number of database resources and pay only for capacity consumed.

    hashtag
    Simple

    Removes the complexity of provisioning and managing database capacity. The database will scale to match your application’s needs.

    hashtag
    Transparent

    Scale database capacity instantly, without disrupting incoming application requests.

    hashtag
    Durable

    Protects against data loss using the distributed, fault-tolerant, self-healing Aurora storage with six-way replication.

    hashtag
    Use cases

    hashtag
    Variable workloads

    You're running an infrequently-used application, with peaks of 30 minutes to several hours a few times each day or several times per year, such as a human resources, budgeting, or operational reporting application. You no longer have to provision to peak capacity, which would require you to pay for resources you don't continuously use, or to average capacity, which would risk performance problems and a poor user experience.

    hashtag
    Unpredictable workloads

    You're running workloads with database usage throughout the day, and also peaks of activity that are hard to predict. For example, a traffic site that might see a surge of activity when it starts raining. Your database will automatically scale capacity to meet the needs of the application's peak load and scale back down when the surge of activity is over.

    hashtag
    Enterprise database fleet management NEW

    Enterprises with hundreds or thousands of applications, each backed by one or more databases, must manage resources for their entire database fleet. As application requirements fluctuate, continuously monitoring and adjusting capacity for each and every database to ensure high performance, high availability, and remaining under budget is a daunting task. With Aurora Serverless v2, database capacity is automatically adjusted based on application demand. You no longer need to manually manage thousands of databases in your database fleet. Features such as global database and Multi-AZ deployments ensure high availability and fast recovery.

    hashtag
    Software as a service applications NEW

    Software as a service (SaaS) vendors typically operate hundreds or thousands of Aurora databases, each supporting a different customer, in a single cluster to improve utilization and cost efficiency. But they still need to manage each database individually, including monitoring for and responding to colocate databases in the same cluster that may take up more shared resources than originally planned. With Aurora Serverless v2, SaaS vendors can provision Aurora database clusters for each individual customer without worrying about costs of provisioned capacity. It automatically shuts down databases when they are not in use to save costs and instantly adjusts databases capacity to meet changing application requirements.

    hashtag
    Scaled-out databases split across multiple servers NEW

    Customers with high write or read requirements often split databases across several instances to achieve higher throughput. However, customers often provision too many or too few instances, increasing cost or limiting scale. With Aurora Serverless v2, customers split databases across several Aurora instances and let the service adjust capacity instantly and automatically based on need. It seamlessly adjusts capacity for each node with no downtime or disruption, and uses only the amount of capacity needed to support applications.

    Amazon Auroraarrow-up-right
    hashtag
    Authentication

    It involves creating the username, password and generating the access keys for the user. With help of access key, it is possible to make programmatic access to the AWS RDS service. The SDK and CLI tools use the access keys to cryptographically sign in with the request.

    We can aslo use an IAM Role to authenticate a user. But the role is not attached to any specific user, rather any user can assume the role temporarily and complete the required task. After the task is over the role can be revoked and the user loses the authentication ability.

    hashtag
    Access Control

    After a user is authenticated, a policy attached to that user determines the type of tasks the uer can carry on. Below is an example of policy which allows the creation of a RDS DB instance, on a t2.micro instance for the DB Engine MySQL.

    hashtag
    Action on Any RDS Resource

    In the below example we see a policy that allows any describe action on any RDS resource. The * symbol is used to represent any resource.

    hashtag
    Disallow deleting a DB Instance

    The below policy disallows a user from deleting a specific DB instance.

    {
        "Version": "2018-09-11",
        "Statement": [
            {
                "Sid": "AllowCreateDBInstanceOnly",
                "Effect": "Allow",
                "Action": [
                    "rds:CreateDBInstance"
                ],
                "Resource": [
                    "arn:aws:rds:*:123456789012:db:test*",
                    "arn:aws:rds:*:123456789012:og:default*",
                    "arn:aws:rds:*:123456789012:pg:default*",
                    "arn:aws:rds:*:123456789012:subgrp:default"
                ],
                "Condition": {
                    "StringEquals": {
                        "rds:DatabaseEngine": "mysql",
                        "rds:DatabaseClass": "db.t2.micro"
                    }
                }
            }
        ]
    }
    {
       "Version":"2012-10-17",
       "Statement":[
          {
             "Sid":"AllowRDSDescribe",
             "Effect":"Allow",
             "Action":"rds:Describe*",
             "Resource":"*"
          }
       ]
    }
    {
       "Version":"2012-10-17",
       "Statement":[
          {
             "Sid":"DenyDelete1",
             "Effect":"Deny",
             "Action":"rds:DeleteDBInstance",
             "Resource":"arn:aws:rds:us-west-2:123456789012:db:my-mysql-instance"
          }
       ]
    }

    1 to 8

    1 to 32

    Low to Moderate

    The instance is healthy and available.

    Yes

    Backing-up

    The instance is currently being backed up.

    Yes

    Queue Depth – It is the number of I/O requests waiting in the queue before they can reach the disk. AWS reports the queue depth for every 1-minute interval. Also a higher queue-depth indicates a slower storage performance.

    Standard

    1 to 64

    1.7 to 256

    450 to 10000

    Memory Optimized

    2 to 128

    17.1 to 3904

    500 to 14000

    Creating

    The instance is being created. The instance is inaccessible while it is being created.

    No

    Deleting

    The instance is being deleted.

    No

    Failed

    The instance has failed and Amazon RDS can't recover it.

    No

    MariaDB

    1000 to 40000

    100 GB to 16 TB

    SQL Server

    1000 to 32000

    20GB to 16 TB

    MySQL / Oracle/ PostgreSQL

    1000 to 40000

    100GB to 16 TB

    Amazon Aurora with MySQL compatibilityarrow-up-right
    Amazon Aurora with PostgreSQL compatibilityarrow-up-right
    MySQLarrow-up-right
    MariaDBarrow-up-right
    PostgreSQLarrow-up-right
    Oraclearrow-up-right
    SQL Serverarrow-up-right
    Amazon RDS on AWS Outpostsarrow-up-right

    Burstable Performance

    Available

    Notifications
    Presets Presets are the templates that contain the settings for transcoding the media file from one format to another format. Elastic transcoder consists of some default presets for common formats. You can also create your own presets that are not included in the default presets. You need to specify a preset that you want to use when you create a job.
  • Notifications Notification is an optional field which you can configure with the Elastic Transcoder. Notification Service is a service that keeps you updated with the status of your job: when Elastic Transcoder starts processing your job, when Elastic Transcoder finishes its job, whether the Elastic Transcoder encounters an error condition or not.You can configure Notifications when you create a pipeline.

  • Restoration

    The DB instance has been restored from a DB snapshot

    Availability

    DB instance is restarting or undergoing controlled shutdown

    Backup

    backup of the DB instance has started, or it is complete

    Configuration change

    The DB instance class for this DB instance is being changed or it is being converted to a Single-AZ DB instance.

    Failover

    The instance has recovered from a partial failover.

    Failure

    The DB instance has failed due to an incompatible configuration

    Notification

    Patching of the DB instance has completed

    Recovery

    Recovery of the DB instance is complete

    Disk space consumption – Investigate disk space consumption if space used is consistently at or above 85 percent of the total disk space. See if it is possible to delete data from the instance or archive data to a different system to free up space.

  • Network traffic – For network traffic, talk with your system administrator to understand what expected throughput is for your domain network and Internet connection. Investigate network traffic if throughput is consistently lower than expected.

  • Database connections – Consider constraining database connections if you see high numbers of user connections in conjunction with decreases in instance performance and response time.

  • IOPS metrics – The expected values for IOPS metrics depend on disk specification and server configuration, so use your baseline to know what is typical. Investigate if values are consistently different than your baseline. For best IOPS performance, make sure your typical working set will fit into memory to minimize read and write operations.

  • hashtag
    Monitoring with Amazon CloudWatch

    Amazon RDS sends metrics and dimensions to Amazon CloudWatch every minute. We can monitor these metrices from the AWS console as shown in the below diagrams.

    hashtag
    Creating a backup from On-Premise DB

    As a first step we create a backup of the on-premise database using the below command. MariaDB being a clone of MySQL, can use nearly all the same commands as MySQL.

    A file with name backupfile.sql is cerated which contains the table structure along with the data to be used.

    AD

    hashtag
    Storing the backup file in S3.

    Upload the backup file created above to a pre-decided Amazon S3 bucket in the same region where the target RDS MariaDB database is present. You can follow this linkarrow-up-right to learn about how to upload.

    hashtag
    Import data from Amazon S3 to RDS- MariaDB database

    You can use the following Amazon CLI command to import the data from S3 to MariaDB DB.

    hashtag
    From Another RDS- MariaDB Instance

    There may be scenarios when you want data from an existing RDS MariaDB DB to be taken into another RDS MariaDB. For example, to cerate a Disaster recovery DB or create a DB only for business reporting etc. In such scenario, we create read replicas which are a copy of their source DB and then promote that read replica to a new DB instance. They are used to prevent direct heavy read from the original source DB when we want to copy the data.

    hashtag
    create a read-replica

    hashtag
    Promote a Read replica to DB Instance

    Now as we have the replica, we can promote it to a standalone DB instance. This will serve our end need of importing data from o RDS – MariaDB DB to a new one. The following command is used to complete the promotion of a read replica to a db instance.

    hashtag
    From Any Database

    In order to import data from any other database to Amazon RDS – MariaDB, we have to use the amazon Data Migration Service also called Amazon DMS. It uses Schema conversion tool to translate the existing data base to a the MYSQL platform. The below diagram explains the overall process. Also it works on the similar principle of replication as described in the previous section.

    hashtag
    Exporting Data from MariaDB

    Exporting of data from Amazon RDS Mysql DB is a straight forwards process where it works on the same replication principle we have seen above. Below are the steps to carry out the export process.

    • Start the instance of MariaDB running external to Amazon RDS.

    • Designate the MariaDB DB instance to be the replication source.

    • Use mysqldump to transfer the database from the Amazon RDS instance to the instance external to Amazon RDS.

    Below is the code for mysqldump command to transfer the data

    Avoid suspending I/O activity on your primary during backup by backing up from your standby instance.

    Use Amazon RDS Multi-AZ synchronous replication technologies to keep data on your standby database instance up to date with the primary.

    Enhance availability by deploying a standby instance in a second AZ, and achieve fault tolerance in the event of an AZ or database instance failure.

    hashtag
    How it works

    In an Amazon RDS Multi-AZ deployment, Amazon RDS automatically creates a primary database (DB) instance and synchronously replicates the data to an instance in a different AZ. When it detects a failure, Amazon RDS automatically fails over to a standby instance without manual intervention.

    hashtag
    Amazon RDS Multi-AZ with two readable standbys

    Automatically fail over in typically under 35 seconds

    Use separate endpoints for reads and writes

    Gain up to 2x faster transaction commit latency

    Increase read capacity

    Automatically failover in typically under 35 seconds with zero data loss and with no manual intervention.

    Route queries to write servers and appropriate read replica standby instances to maximize performance and scalability.

    Achieve up to 2x improved write latency compared to Multi-AZ with one standby.

    Gain read scalability by distributing traffic across two readable standby instances.

    hashtag
    How it works

    Deploy highly available, durable MySQL or PostgreSQL databases in three AZs using Amazon RDS Multi-AZ with two readable standbys. Gain automatic failovers in typically under 35 seconds, up to 2x faster transaction commit latency compared to Amazon RDS Multi-AZ with one standby, additional read capacity, and a choice of AWS Graviton2– or Intel–based instances for compute.

    hashtag
    Introduction to Amazon RDS Multi-AZ

    Amazon RDS Multi-AZ deployments provide enhanced availability and durability for your Amazon RDS database (DB) instances, making them a natural fit for production database workloads. With two different deployment options, you can customize your workloads for the availability they need.

    hashtag
    Comparison Table

    Amazon RDS Single-AZ or Amazon RDS Multi-AZ with one standby or Amazon RDS Multi-AZ with two readable standbys

    Feature

    Single-AZ

    Multi-AZ with one standby

    Multi-AZ with two readable standbys

    Available engines

    • Amazon RDS for MariaDB

    • Amazon RDS for MySQL

    • Amazon RDS for PostgreSQL

    • Amazon RDS for MariaDB

    • Amazon RDS for MySQL

    • Amazon RDS for PostgreSQL

    • Amazon RDS for PostgreSQL

    • Amazon RDS for MySQL

    Additional Read capacity

    • None: the read capacity is limited to your primary

    • None: Your standby DB instance is only a passive failover target for high availability

    • Two standby DB instances act as failover targets and serve read traffic

    • Read capacity is determined by the overhead of write transactions from the primary

    ·

    Lower latency (higher throughput) for transaction commits

    Support high availability for your application with automatic database failover that completes as quickly as 60 seconds with zero data loss and no manual intervention.

    The following diagram shows how we can configure the automated backup window for a DB instance using the AWS console. To disable the automated backup, set the number of days to zero.

    hashtag
    Manual Backup

    We can also take backups manually by using snapshots. To take a snapshot manually we use the instance action option after selecting the instance as shown below.

    We can aslo take manual backup using the CLI with the below command.

    aws rds create-db-snapshot /
        --db-instance-identifier sourcedbinstance /
        --db-snapshot-identifier dbsnapshotinstance
    Then you’ll love this guide.

    TABLE OF CONTENTS

    1. Kubernetes Architecturearrow-up-right

      1. Control Planearrow-up-right

      2. Worker Nodearrow-up-right

    Note: To understand Kubernetes architecture better, there are some prerequisites Please check the prerequisites in the kubernetes learning guidearrow-up-right to know more.

    hashtag
    Kubernetes Architecture

    The following Kubernetes architecture diagram shows all the components of the Kubernetes cluster and how external systems connect to the Kubernetes cluster.

    The first and foremost thing you should understand about Kubernetes is, it is a distributed system. Meaning, it has multiple components spread across different servers over a network. These servers could be Virtual machines or bare metal servers. We call it a Kubernetes cluster.

    A Kubernetes cluster consists of control plane nodes and worker nodes.

    hashtag
    Control Plane

    The control plane is responsible for container orchestration and maintaining the desired state of the cluster. It has the following components.

    1. kube-apiserver

    2. etcd

    3. kube-scheduler

    4. kube-controller-manager

    5. cloud-controller-manager

    hashtag
    Worker Node

    The Worker nodes are responsible for running containerized applications. The worker Node has the following components.

    1. kubelet

    2. kube-proxy

    3. Container runtime

    hashtag
    Kubernetes Control Plane Components

    First, let’s take a look at each control plane component and the important concepts behind each component.

    hashtag
    1. kube-apiserver

    The kube-api server is the central hub of the Kubernetes cluster that exposes the Kubernetes API.

    End users, and other cluster components, talk to the cluster via the API server. Very rarely monitoring systems and third-party services may talk to API servers to interact with the cluster.

    So when you use kubectl to manage the cluster, at the backend you are actually communicating with the API server through HTTP REST APIs. However, the internal cluster components like the scheduler, controller, etc talk to the API server using gRPCarrow-up-right.

    The communication between the API server and other components in the cluster happens over TLS to prevent unauthorized access to the cluster.

    Kubernetes api-server is responsible for the following

    1. API management: Exposes the cluster API endpoint and handles all API requests.

    2. Authentication (Using client certificates, bearer tokens, and HTTP Basic Authentication) and Authorization (ABAC and RBAC evaluation)

    3. Processing API requests and validating data for the API objects like pods, services, etc. (Validation and Mutation Admission controllers)

    4. It is the only component that communicates with etcd.

    5. api-server coordinates all the processes between the control plane and worker node components.

    6. api-server has a built-in bastion apiserver proxy. It is part of the API server process. It is primarily used to enable access to ClusterIP services from outside the cluster, even though these services are typically only reachable within the cluster itself.

    Note: To reduce the cluster attack surface, it is crucial to secure the API server. The Shadowserver Foundation has conducted an experiment that discovered 380 000 publicly accessible Kubernetes API serversarrow-up-right.

    hashtag
    2. etcd

    Kubernetes is a distributed system and it needs an efficient distributed database like etcd that supports its distributed nature. It acts as both a backend service discovery and a database. You can call it the brain of the Kubernetes cluster.

    etcdarrow-up-right is an open-source strongly consistent, distributed key-value store. So what does it mean?

    1. Strongly consistent: If an update is made to a node, strong consistency will ensure it gets updated to all the other nodes in the cluster immediately. Also if you look at CAP theoremarrow-up-right, achieving 100% availability with strong consistency and & Partition Tolerance is impossible.

    2. Distributed: etcd is designed to run on multiple nodes as a cluster without sacrificing consistency.

    3. Key Value Store: A nonrelational database that stores data as keys and values. It also exposes a key-value API. The datastore is built on top of which is a fork of BoltDB.

    etcd uses raft consensus algorithm arrow-up-rightfor strong consistency and availability. It works in a leader-member fashion for high availability and to withstand node failures.

    So how etcd works with Kubernetes?

    To put it simply, when you use kubectl to get kubernetes object details, you are getting it from etcd. Also, when you deploy an object like a pod, an entry gets created in etcd.

    In a nutshell, here is what you need to know about etcd.

    1. etcd stores all configurations, states, and metadata of Kubernetes objects (pods, secrets, daemonsets, deploymentsarrow-up-right, configmaps, statefulsets, etc).

    2. etcd allows a client to subscribe to events using Watch() API . Kubernetes api-server uses the etcd’s watch functionality to track the change in the state of an object.

    3. etcd exposes key-value API . Also, the is a RESTful proxy that translates all the HTTP API calls into gRPC messages. It makes it an ideal database for Kubernetes.

    4. etcd stores all objects under the /registry directory key in key-value format. For example, information on a pod named Nginx in the default namespace can be found under /registry/pods/default/nginx

    Also, etcd it is the only Statefulset component in the control plane.

    hashtag
    3. kube-scheduler

    The kube-scheduler is responsible for scheduling pods on worker nodes.

    When you deploy a pod, you specify the pod requirements such as CPU, memory, affinity, taints or tolerations, priority, persistent volumes (PV), etc. The scheduler’s primary task is to identify the create request and choose the best node for a pod that satisfies the requirements.

    The following image shows a high-level overview of how the scheduler works.

    In a Kubernetes cluster, there will be more than one worker node. So how does the scheduler select the node out of all worker nodes?

    Here is how the scheduler works.

    1. To choose the best node, the Kube-scheduler uses filtering and scoring operations.

    2. In filtering, the scheduler finds the best-suited nodes where the pod can be scheduled. For example, if there are five worker nodes with resource availability to run the pod, it selects all five nodes. If there are no nodes, then the pod is unschedulable and moved to the scheduling queue. If It is a large cluster, let’s say 100 worker nodes, and the scheduler doesn’t iterate over all the nodes. There is a scheduler configuration parameter called percentageOfNodesToScore. The default value is typically 50%. So it tries to iterate over 50% of nodes in a round-robin fashion. If the worker nodes are spread across multiple zones, then the scheduler iterates over nodes in different zones. For very large clusters the default percentageOfNodesToScore is 5%.

    3. In the scoring phase, the scheduler ranks the nodes by assigning a score to the filtered worker nodes. The scheduler makes the scoring by calling multiple . Finally, the worker node with the highest rank will be selected for scheduling the pod. If all the nodes have the same rank, a node will be selected at random.

    4. Once the node is selected, the scheduler creates a binding event in the API server. Meaning an event to bind a pod and node.

    Things should know about a scheduler.

    1. It is a controller that listens to pod creation events in the API server.

    2. The scheduler has two phases. Scheduling cycle and the Binding cycle. Together it is called the scheduling context. The scheduling cycle selects a worker node and the binding cycle applies that change to the cluster.

    3. The scheduler always places the high-priority pods ahead of the low-priority pods for scheduling. Also, in some cases, after the pod started running in the selected node, the pod might get evicted or moved to other nodes. If you want to understand more, read the

    4. You can create custom schedulers and run multiple schedulers in a cluster along with the native scheduler. When you deploy a pod you can specify the custom scheduler in the pod manifest. So the scheduling decisions will be taken based on the custom scheduler logic.

    5. The scheduler has a . Meaning, you can add your custom plugin to the scheduling workflow.

    hashtag
    4. Kube Controller Manager

    What is a controller? Controllersarrow-up-right are programs that run infinite control loops. Meaning it runs continuously and watches the actual and desired state of objects. If there is a difference in the actual and desired state, it ensures that the kubernetes resource/object is in the desired state.

    As per the official documentation,

    In Kubernetes, controllers are control loops that watch the state of your cluster, then make or request changes where needed. Each controller tries to move the current cluster state closer to the desired state.

    Let’s say you want to create a deployment, you specify the desired state in the manifest YAML file (declarative approach). For example, 2 replicas, one volume mount, configmap, etc. The in-built deployment controller ensures that the deployment is in the desired state all the time. If a user updates the deployment with 5 replicas, the deployment controller recognizes it and ensures the desired state is 5 replicas.

    Kube controller manager is a component that manages all the Kubernetes controllers. Kubernetes resources/objects like pods, namespaces, jobs, replicaset are managed by respective controllers. Also, the kube scheduler is also a controller managed by Kube controller manager.

    Following is the list of important built-in Kubernetes controllers.

    1. Deployment controller

    2. Replicaset controller

    3. DaemonSet controller

    4. Job Controller ()

    5. CronJob Controller

    6. endpoints controller

    7. namespace controller

    8. controller.

    9. Node controller

    Here is what you should know about the Kube controller manager.

    1. It manages all the controllers and the controllers try to keep the cluster in the desired state.

    2. You can extend kubernetes with custom controllers associated with a custom resource definition.

    hashtag
    5. Cloud Controller Manager (CCM)

    When kubernetes is deployed in cloud environments, the cloud controller manager acts as a bridge between Cloud Platform APIs and the Kubernetes cluster.

    This way the core kubernetes core components can work independently and allow the cloud providers to integrate with kubernetes using plugins. (For example, an interface between kubernetes cluster and AWS cloud API)

    Cloud controller integration allows Kubernetes cluster to provision cloud resources like instances (for nodes), Load Balancers (for services), and Storage Volumes (for persistent volumes).

    Cloud Controller Manager contains a set of cloud platform-specific controllers that ensure the desired state of cloud-specific components (nodes, Loadbalancers, storage, etc). Following are the three main controllers that are part of the cloud controller manager.

    1. Node controller: This controller updates node-related information by talking to the cloud provider API. For example, node labeling & annotation, getting hostname, CPU & memory availability, nodes health, etc.

    2. Route controller: It is responsible for configuring networking routes on a cloud platform. So that pods in different nodes can talk to each other.

    3. Service controller: It takes care of deploying load balancers for kubernetes services, assigning IP addresses, etc.

    Following are some of the classic examples of cloud controller manager.

    1. Deploying Kubernetes Service of type Load balancer. Here Kubernetes provisions a Cloud-specific Loadbalancer and integrates with Kubernetes Service.

    2. Provisioning storage volumes (PV) for pods backed by cloud storage solutions.

    Overall Cloud Controller Manager manages the lifecycle of cloud-specific resources used by kubernetes.

    hashtag
    Kubernetes Worker Node Components

    Now let’s look at each of the worker node components.

    hashtag
    1. Kubelet

    Kubelet is an agent component that runs on every node in the cluster. t does not run as a container instead runs as a daemon, managed by systemd.

    It is responsible for registering worker nodes with the API server and working with the podSpec (Pod specification – YAML or JSON) primarily from the API server. podSpec defines the containers that should run inside the pod, their resources (e.g. CPU and memory limits), and other settings such as environment variables, volumes, and labels.

    It then brings the podSpec to the desired state by creating containers.

    To put it simply, kubelet is responsible for the following.

    1. Creating, modifying, and deleting containers for the pod.

    2. Responsible for handling liveliness, readiness, and startup probes.

    3. Responsible for Mounting volumes by reading pod configuration and creating respective directories on the host for the volume mount.

    4. Collecting and reporting Node and pod status via calls to the API server.

    Kubelet is also a controller where it watches for pod changes and utilizes the node’s container runtime to pull images, run containers, etc.

    Other than PodSpecs from the API server, kubelet can accept podSpec from a file, HTTP endpoint, and HTTP server. A good example of “podSpec from a file” is Kubernetes static pods.

    Static pods are controlled by kubelet, not the API servers.

    This means you can create pods by providing a pod YAML location to the Kubelet component. However, static pods created by Kubelet are not managed by the API server.

    Here is a real-world example use case of the static pod.

    While bootstrapping the control plane, kubelet starts the api-server, scheduler, and controller manager as static pods from podSpecs located at /etc/kubernetes/manifests

    Following are some of the key things about kubelet.

    1. Kubelet uses the CRI (container runtime interface) gRPC interface to talk to the container runtime.

    2. It also exposes an HTTP endpoint to stream logs and provides exec sessions for clients.

    3. Uses the CSI (container storage interface) gRPC to configure block volumes.

    4. It uses the CNI plugin configured in the cluster to allocate the pod IP address and set up any necessary network routes and firewall rules for the pod.

    hashtag
    2. Kube proxy

    To understand kube proxy, you need to have a basic knowledge of Kubernetes Service & endpoint objects.

    Service in Kubernetes is a way to expose a set of pods internally or to external traffic. When you create the service object, it gets a virtual IP assigned to it. It is called clusterIP. It is only accessible within the Kubernetes cluster.

    The Endpoint object contains all the IP addresses and ports of pod groups under a Service object. The endpoints controller is responsible for maintaining a list of pod IP addresses (endpoints). The service controller is responsible for configuring endpoints to a service.

    You cannot ping the ClusterIP because it is only used for service discovery, unlike pod IPs which are pingable.

    Now let’s understand Kube Proxy.

    Kube-proxy is a daemon that runs on every node as a daemonsetarrow-up-right. It is a proxy component that implements the Kubernetes Services concept for pods. (single DNS for a set of pods with load balancing). It primarily proxies UDP, TCP, and SCTP and does not understand HTTP.

    When you expose pods using a Service (ClusterIP), Kube-proxy creates network rules to send traffic to the backend pods (endpoints) grouped under the Service object. Meaning, all the load balancing, and service discovery are handled by the Kube proxy.

    So how does Kube-proxy work?

    Kube proxy talks to the API server to get the details about the Service (ClusterIP) and respective pod IPs & ports (endpoints). It also monitors for changes in service and endpoints.

    Kube-proxy then uses any one of the following modes to create/update rules for routing traffic to pods behind a Service

    1. IPTablesarrow-up-right: It is the default mode. In IPTables mode, the traffic is handled by IPtable rules. In this mode, kube-proxy chooses the backend pod random for load balancing. Once the connection is established, the requests go to the same pod until the connection is terminated.

    2. IPVSarrow-up-right: For clusters with services exceeding 1000, IPVS offers performance improvement. It supports the following load-balancing algorithms for the backend.

      1. rr: round-robin : It is the default mode.

      2. lc: least connection (smallest number of open connections)

      3. dh: destination hashing

      4. sh: source hashing

      5. sed: shortest expected delay

      6. nq: never queue

    3. Userspace (legacy & not recommended)

    4. Kernelspace: This mode is only for windows systems.

    If you would like to understand the performance difference between kube-proxy IPtables and IPVS mode, read this articlearrow-up-right.

    Also, you can run a Kubernetes cluster without kube-proxy by replacing it with Ciliumarrow-up-right.

    hashtag
    3. Container Runtime

    You probably know about Java Runtime (JRE)arrow-up-right. It is the software required to run Java programs on a host. In the same way, container runtime is a software component that is required to run containers.

    Container runtime runs on all the nodes in the Kubernetes cluster. It is responsible for pulling images from container registries, running containers, allocating and isolating resources for containers, and managing the entire lifecycle of a container on a host.

    To understand this better, let’s take a look at two key concepts:

    1. Container Runtime Interface (CRI): It is a set of APIs that allows Kubernetes to interact with different container runtimes. It allows different container runtimes to be used interchangeably with Kubernetes. The CRI defines the API for creating, starting, stopping, and deleting containers, as well as for managing images and container networks.

    2. Open Container Initiative (OCI): It is a set of standards for container formats and runtimes

    Kubernetes supports multiple container runtimesarrow-up-right (CRI-O, Docker Engine, containerd, etc) that are compliant with Container Runtime Interface (CRI)arrow-up-right. This means, all these container runtimes implement the CRI interface and expose gRPC CRI APIsarrow-up-right (runtime and image service endpoints).

    So how does Kubernetes make use of the container runtime?

    As we learned in the Kubelet section, the kubelet agent is responsible for interacting with the container runtime using CRI APIs to manage the lifecycle of a container. It also gets all the container information from the container runtime and provides it to the control plane.

    Let’s take an example of CRI-Oarrow-up-right container runtime interface. Here is a high-level overview of how container runtime works with kubernetes.

    1. When there is a new request for a pod from the API server, the kubelet talks to CRI-O daemon to launch the required containers via Kubernetes Container Runtime Interface.

    2. CRI-O checks and pulls the required container image from the configured container registry using containers/image library.

    3. CRI-O then generates OCI runtime specification (JSON) for a container.

    4. CRI-O then launches an OCI-compatible runtime (runc) to start the container process as per the runtime specification.

    hashtag
    Kubernetes Cluster Addon Components

    Apart from the core components, the kubernetes cluster needs addon components to be fully operational. Choosing an addon depends on the project requirements and use cases.

    Following are some of the popular addon components that you might need on a cluster.

    1. CNI Plugin (Container Network Interface)

    2. CoreDNS (For DNS server): CoreDNS acts as a DNS server within the Kubernetes cluster. By enabling this addon, you can enable DNS-based service discovery.

    3. Metrics Server (For Resource Metrics): This addon helps you collect performance data and resource usage of Nodes and pods in the cluster.

    4. Web UI (Kubernetes Dashboard): This addon enables the Kubernetes dashboard for managing the object via web UI.

    hashtag
    1. CNI Plugin

    First, you need to understand Container Networking Interface (CNI)arrow-up-right

    It is a plugin-based architecture with vendor-neutral specificationsarrow-up-right and libraries for creating network interfaces for Containers.

    It is not specific to Kubernetes. With CNI container networking can be standardized across container orchestration tools like Kubernetes, Mesos, CloudFoundry, Podman, Docker, etc.

    When it comes to container networking, companies might have different requirements such as network isolation, security, encryption, etc. As container technology advanced, many network providers created CNI-based solutions for containers with a wide range of networking capabilities. You can call it as CNI-Plugins

    This allows users to choose a networking solution that best fits their needs from different providers.

    How does CNI Plugin work with Kubernetes?

    1. The Kube-controller-manager is responsible for assigning pod CIDR to each node. Each pod gets a unique IP address from the pod CIDR.

    2. Kubelet interacts with container runtime to launch the scheduled pod. The CRI plugin which is part of the Container runtime interacts with the CNI plugin to configure the pod network.

    3. CNI Plugin enables networking between pods spread across the same or different nodes using an overlay network.

    Following are high-level functionalities provided by CNI plugins.

    1. Pod Networking

    2. Pod network security & isolation using Network Policies to control the traffic flow between pods and between namespaces.

    Some popular CNI plugins include:

    1. Calico

    2. Flannel

    3. Weave Net

    4. Cilium (Uses eBPF)

    5. Amazon VPC CNI (For AWS VPC)

    6. Azure CNI (For Azure Virtual network)Kubernetes networking is a big topic and it differs based on the hosting platforms.

    successThreshold

    The number of consecutive success results needed to switch probe status to “Success”.

    1

    failureThreshold

    The number of consecutive failed results needed to switch probe status to “Failure”.

    3

    Quick Tutorial: Working with Kubernetes Namespacesarrow-up-right
    Creating Namespacesarrow-up-right
    Viewing Namespacesarrow-up-right
    Creating Resources in the Namespacearrow-up-right
    admission controllerarrow-up-right
    Extended Resourcesarrow-up-right
    ExtendedResourceTolerationarrow-up-right

    Unlimited Throughput – Standard queues support a nearly unlimited number of API calls per second, per API action (SendMessage, ReceiveMessage, or DeleteMessage).

    At-Least-Once Delivery – A message is delivered at least once, but occasionally more than one copy of a message is delivered.

    Best-Effort Ordering – Occasionally, messages are delivered in an order different from which they were sent.

    High Throughput – If you use batchingarrow-up-right, FIFO queues support up to 3,000 calls per second, per API method (SendMessageBatch, ReceiveMessage, or DeleteMessageBatch). The 3,000 calls per second represent 300 API calls, each with a batch of 10 messages. To request a quota increase, submit a support requestarrow-up-right. Without batching, FIFO queues support up to 300 API calls per second, per API method (SendMessage, ReceiveMessage, or DeleteMessage).

    Exactly-Once Processing – A message is delivered once and remains available until a consumer processes and deletes it. Duplicates aren't introduced into the queue.

    First-In-First-Out Delivery – The order in which messages are sent and received is strictly preserved.

    Send data between applications when the throughput is important, for example:

    • Decouple live user requests from intensive background work: let users upload media while resizing or encoding it.

    • Allocate tasks to multiple worker nodes: process a high number of credit card validation requests.

    • Batch messages for future processing: schedule multiple entries to be added to a database.

    Send data between applications when the order of events is important, for example:

    • Make sure that user-entered commands are run in the right order.

    • Display the correct product price by sending price modifications in the right order.

    • Prevent a student from enrolling in a course before registering for an account.

    visibility timeoutarrow-up-right
    Amazon SQS Standard queuesarrow-up-right
    Amazon SQS FIFO (First-In-First-Out) queuesarrow-up-right

    AWS S3

    Amazon S3 has various features you can use to organize and manage your data in ways that support specific use cases, enable cost efficiencies, enforce security, and meet compliance requirements. Data is stored as objects within resources called “buckets”, and a single object can be up to 5 terabytes in size. S3 features include capabilities to append metadata tags to objects, move and store data across the S3 Storage Classes, configure and enforce data access controls, secure data against unauthorized users, run big data analytics, monitor data at the object and bucket levels, and view storage usage and activity trends across your organization. Objects can be accessed through S3 Access Points or directly through the bucket hostname.

    hashtag
    Storage management and monitoring

    Amazon S3’s flat, non-hierarchical structure and various management features are helping customers of all sizes and industries organize their data in ways that are valuable to their businesses and teams. All objects are stored in S3 buckets and can be organized with shared names called prefixes. You can also append up to 10 key-value pairs called S3 object tags to each object, which can be created, updated, and deleted throughout an object’s lifecycle. To keep track of objects and their respective tags, buckets, and prefixes, you can use an S3 Inventory report that lists your stored objects within an S3 bucket or with a specific prefix, and their respective metadata and encryption status. S3 Inventory can be configured to generate reports on a daily or a weekly basis.

    hashtag
    Storage management

    With S3 bucket names, prefixes, object tags, and S3 Inventory, you have a range of ways to categorize and report on your data, and subsequently can configure other S3 features to take action. Whether you store thousands of objects or a billion, makes it simple to manage your data in Amazon S3 at any scale. With S3 Batch Operations, you can copy objects between buckets, replace object tag sets, modify access controls, and restore archived objects from S3 Glacier Flexible Retrieval and S3 Glacier Deep Archive storage classes, with a single S3 API request or a few steps in the S3 console. You can also use S3 Batch Operations to run AWS Lambda functions across your objects to run custom business logic, such as processing data or transcoding image files. To get started, specify a list of target objects by using an S3 Inventory report or by providing a custom list, and then select the desired operation from a pre-populated menu. When an S3 Batch Operation request is done, you'll receive a notification and a completion report of all changes made. Learn more about S3 Batch Operations by .

    Amazon S3 also supports features that help maintain data version control, prevent accidental deletions, and replicate data to the same or a different AWS Region. With S3 Versioning, you can preserve, retrieve, and restore every version of an object stored in Amazon S3, which allows you to recover from unintended user actions and application failures. To prevent accidental deletions, enable Multi-Factor Authentication (MFA) Delete on an S3 bucket. If you try to delete an object stored in an MFA Delete-enabled bucket, it will require two forms of authentication: your AWS account credentials and the concatenation of a valid serial number, a space, and the six-digit code displayed on an approved authentication device, like a hardware key fob or a Universal 2nd Factor (U2F) security key.

    With , you can replicate objects (and their respective metadata and object tags) to one or more destination buckets into the same or different AWS Regions for reduced latency, compliance, security, disaster recovery, and other use cases. You can configure to replicate objects from a source S3 bucket to one or more destination buckets in different AWS Regions. replicates objects between buckets in the same AWS Region. While live replication like CRR and SRR automatically replicates newly uploaded objects as they are written to your bucket, allows you to replicate existing objects. You can use S3 Batch Replication to backfill a newly created bucket with existing objects, retry objects that were previously unable to replicate, migrate data across accounts, or add new buckets to your data lake. helps you meet compliance requirements for data replication by providing an SLA and visibility into replication times.

    To access replicated data sets in S3 buckets across AWS Regions and accounts, use Amazon to create a single global endpoint for your applications and clients to use regardless of their location. This global endpoint allows you to build multi-Region applications with the same simple architecture you would use in a single Region, and then to run those applications anywhere in the world. Amazon S3 Multi-Region Access Points can accelerate performance by up to 60% when accessing data sets that are replicated across multiple AWS Regions and accounts. Based on AWS Global Accelerator, S3 Multi-Region Access Points consider factors like network congestion and the location of the requesting application to dynamically route your requests over the AWS network to the lowest latency copy of your data. Using , you can failover between your replicated data sets across AWS Regions, allowing you to shift your S3 data request traffic to an alternate AWS Region within minutes.

    You can also enforce write-once-read-many (WORM) policies with . This S3 management feature blocks object version deletion during a customer-defined retention period so that you can enforce retention policies as an added layer of data protection or to meet compliance obligations. You can migrate workloads from existing WORM systems into Amazon S3, and configure S3 Object Lock at the object- and bucket-levels to prevent object version deletions prior to a pre-defined Retain Until Date or Legal Hold Date. Objects with S3 Object Lock retain WORM protection, even if they are moved to different storage classes with an S3 Lifecycle policy. To track what objects have S3 Object Lock, you can refer to an S3 Inventory report that includes the WORM status of objects. S3 Object Lock can be configured in one of two modes. When deployed in Governance mode, AWS accounts with specific IAM permissions are able to remove S3 Object Lock from objects. If you require stronger immutability in order to comply with regulations, you can use Compliance Mode. In Compliance Mode, the protection cannot be removed by any user, including the root account.

    hashtag
    Storage monitoring

    In addition to these management capabilities, use Amazon S3 features and other AWS services to monitor and control your S3 resources. Apply tags to S3 buckets to allocate costs across multiple business dimensions (such as cost centers, application names, or owners), then use AWS Cost Allocation Reports to view the usage and costs aggregated by the bucket tags. You can also use Amazon CloudWatch to track the operational health of your AWS resources and configure billing alerts for estimated charges that reach a user-defined threshold. Use AWS CloudTrail to track and report on bucket- and object-level activities, and configure S3 Event Notifications to trigger workflows and alerts or invoke AWS Lambda when a specific change is made to your S3 resources. S3 Event Notifications automatically transcodes media files as they’re uploaded to S3, processes data files as they become available, and synchronizes objects with other data stores. Additionally, you can verify integrity of data transferred to and from Amazon S3, and can access the checksum information at any time using the GetObjectAttributes S3 API or an S3 Inventory report. You can choose from four supported checksum algorithms (SHA-1, SHA-256, CRC32, or CRC32C) for data integrity checking on your upload and download requests depending on your application needs.

    Learn more about and

    hashtag
    Storage analytics and insights

    hashtag
    S3 Storage Lens

    delivers organization-wide visibility into object storage usage, activity trends, and makes actionable recommendations to improve cost-efficiency and apply data protection best practices. S3 Storage Lens is the first cloud storage analytics solution to provide a single view of object storage usage and activity across hundreds, or even thousands, of accounts in an organization, with drill-downs to generate insights at the account, bucket, or even prefix level. Drawing from more than 14 years of experience helping customers optimize their storage, S3 Storage Lens analyzes organization-wide metrics to deliver contextual recommendations to find ways to reduce storage costs and apply best practices on data protection. To learn more, visit the

    hashtag
    S3 Storage Class Analysis

    Amazon S3 Storage Class Analysis analyzes storage access patterns to help you decide when to transition the right data to the right storage class. This Amazon S3 feature observes data access patterns to help you determine when to transition less frequently accessed storage to a lower-cost storage class. You can use the results to help improve your S3 Lifecycle policies. You can configure storage class analysis to analyze all the objects in a bucket. Or, you can configure filters to group objects together for analysis by common prefix, by object tags, or by both prefix and tags. To learn more, visit the .

    hashtag
    Storage classes

    With Amazon S3, you can store data across a range of different S3 storage classes purpose-built for specific use cases and access patterns: S3 Intelligent-Tiering, S3 Standard, S3 Standard-Infrequent Access (S3 Standard-IA), S3 One Zone-Infrequent Access (S3 One Zone-IA), S3 Glacier Instant Retrieval, S3 Glacier Flexible Retrieval, S3 Glacier Deep Archive, and S3 Outposts.

    Every S3 storage class supports a specific data access level at corresponding costs or geographic location.

    For data with changing, unknown, or unpredictable access patterns, such as data lakes, analytics, or new applications, use S3 Intelligent-Tiering, which automatically optimizes your storage costs. S3 Intelligent-Tiering automatically moves your data between three low latency access tiers optimized for frequent, infrequent, and rare access. When subsets of objects become archived over time, you can activate the archive access tier designed for asynchronous access.

    For more predictable access patterns, you can store mission-critical production data in S3 Standard for frequent access, save costs by storing infrequently accessed data in S3 Standard-IA or S3 One Zone-IA, and archive data at the lowest costs in the archival storage classes — S3 Glacier Instant Retrieval, S3 Glacier Flexible Retrieval, and S3 Glacier Deep Archive. You can use S3 Storage Class Analysis to monitor access patterns across objects to discover data that should be moved to lower-cost storage classes. Then you can use this information to configure an S3 Lifecycle policy that makes the data transfer. S3 Lifecycle policies can also be used to expire objects at the end of their lifecycles.

    If you have data residency requirements that can’t be met by an existing AWS Region, you can use the S3 Outposts storage class to store your S3 data on premises using S3 on Outposts.

    Learn more by visiting , , and

    hashtag
    Access management and security

    hashtag
    Access management

    To protect your data in Amazon S3, by default, users only have access to the S3 resources they create. You can grant access to other users by using one or a combination of the following access management features: AWS Identity and Access Management (IAM) to create users and manage their respective access; Access Control Lists (ACLs) to make individual objects accessible to authorized users; bucket policies to configure permissions for all objects within a single S3 bucket; to simplify managing data access to shared data sets by creating access points with names and permissions specific to each application or sets of applications; and Query String Authentication to grant time-limited access to others with temporary URLs. Amazon S3 also supports Audit Logs that list the requests made against your S3 resources for complete visibility into who is accessing what data.

    hashtag
    Security

    Amazon S3 offers flexible security features to block unauthorized users from accessing your data. Use VPC endpoints to connect to S3 resources from your Amazon Virtual Private Cloud (Amazon VPC) and from on-premises. Amazon S3 encrypts all new data uploads to any bucket (as of January 5, 2023). Amazon S3 supports both server-side encryption (with three key management options) and client-side encryption for data uploads. Use S3 Inventory to check the encryption status of your S3 objects (see for more information on S3 Inventory). is a set of security controls that ensures S3 buckets and objects do not have public access. With a few clicks in the Amazon S3 Management Console, you can apply the S3 Block Public Access settings to all buckets within your AWS account or to specific S3 buckets. Once the settings are applied to an AWS account, any existing or new buckets and objects associated with that account inherit the settings that prevent public access. S3 Block Public Access settings override other S3 access permissions, making it easy for the account administrator to enforce a “no public access” policy regardless of how an object is added, how a bucket is created, or if there are existing access permissions. S3 Block Public Access controls are auditable, provide a further layer of control, and use AWS Trusted Advisor bucket permission checks, AWS CloudTrail logs, and Amazon CloudWatch alarms. You should enable Block Public Access for all accounts and buckets that you do not want publicly accessible.

    is a feature that disables Access Control Lists (ACLs), changing ownership for all objects to the bucket owner and simplifying access management for data stored in S3. When you configure the S3 Object Ownership Bucket owner enforced setting, ACLs will no longer affect permissions for your bucket and the objects in it. All access control will be defined using resource-based policies, user policies, or some combination of these. Before you disable ACLs, review your bucket and object ACLs. To identify Amazon S3 requests that required ACLs for authorization, you can use the aclRequired field in or .

    Using S3 Access Points that are restricted to a Virtual Private Cloud (VPC), you can easily firewall your S3 data within your private network. Additionally, you can use AWS Service Control Policies to require that any new S3 Access Point in your organization is restricted to VPC-only access.

    is a feature that helps you simplify permissions management as you set, verify, and refine policies for your S3 buckets and access points. Access Analyzer for S3 monitors your existing bucket access policies to verify that they provide only the required access to your S3 resources. Access Analyzer for S3 evaluates your bucket access policies so that you can swiftly remediate any buckets with access that isn't required. When reviewing results that show potentially shared access to a bucket, you can Block Public Access to the bucket with a single click in the S3 console. For auditing purposes, you can download Access Analyzer for S3 findings as a CSV report. Additionally, the S3 console reports security warnings, errors, and suggestions from IAM Access Analyzer as you author your S3 policies. The console automatically runs more than 100 policy checks to validate your policies. These checks save you time, guide you to resolve errors, and help you apply security best practices.

    IAM makes it easier for you to analyze access and reduce permissions to achieve least privilege by providing the timestamp when a user or role last used S3 and the associated actions. Use this “last accessed” information to analyze S3 access, identify unused permissions, and remove them confidently. To learn more see .

    You can use to discover and protect sensitive data stored in Amazon S3. Macie automatically gathers a complete S3 inventory and continually evaluates every bucket to alert on any publicly accessible buckets, unencrypted buckets, or buckets shared or replicated with AWS accounts outside of your organization. Then, Macie applies machine learning and pattern matching techniques to the buckets you select to identify and alert you to sensitive data, such as personally identifiable information (PII). As security findings are generated, they are pushed out to the Amazon CloudWatch Events, making it easy to integrate with existing workflow systems and to trigger automated remediation with services like AWS Step Functions to take action like closing a public bucket or adding resource tags.

    provides private connectivity between Amazon S3 and on-premises. You can provision interface VPC endpoints for S3 in your VPC to connect your on-premises applications directly with S3 over AWS Direct Connect or AWS VPN. Requests to interface VPC endpoints for S3 are automatically routed to S3 over the Amazon network. You can set security groups and configure VPC endpoint policies for your interface VPC endpoints for additional access controls.

    Learn more by visiting and

    hashtag
    Data processing

    hashtag
    S3 Object Lambda

    With you can add your own code to S3 GET, HEAD, and LIST requests to modify and process data as it is returned to an application. You can use custom code to modify the data returned by standard S3 GET requests to filter rows, dynamically resize images, redact confidential data, and much more. You can also use S3 Object Lambda to modify the output of S3 LIST requests to create a custom view of objects in a bucket and S3 HEAD requests to modify object metadata like object name and size. Powered by AWS Lambda functions, your code runs on infrastructure that is fully managed by AWS, eliminating the need to create and store derivative copies of your data or to run expensive proxies, all with no changes required to applications.

    S3 Object Lambda uses AWS Lambda functions to automatically process the output of a standard S3 GET, HEAD, or LIST request. AWS Lambda is a serverless compute service that runs customer-defined code without requiring management of underlying compute resources. With just a few clicks in the AWS Management Console, you can configure a Lambda function and attach it to a S3 Object Lambda Access Point. From that point forward, S3 will automatically call your Lambda function to process any data retrieved through the S3 Object Lambda Access Point, returning a transformed result back to the application. You can author and execute your own custom Lambda functions, tailoring S3 Object Lambda’s data transformation to your specific use case.

    hashtag
    Query in place

    Amazon S3 has a built-in feature and complementary services that query data without needing to copy and load it into a separate analytics platform or data warehouse. This means you can run big data analytics directly on your data stored in Amazon S3. S3 Select is an S3 feature designed to increase query performance by up to 400%, and reduce querying costs as much as 80%. It works by retrieving a subset of an object’s data (using simple SQL expressions) instead of the entire object, which can be up to 5 terabytes in size.

    Amazon S3 is also compatible with AWS analytics services Amazon Athena and Amazon Redshift Spectrum. Amazon Athena queries your data in Amazon S3 without needing to extract and load it into a separate service or platform. It uses standard SQL expressions to analyze your data, delivers results within seconds, and is commonly used for ad hoc data discovery. Amazon Redshift Spectrum also runs SQL queries directly against data at rest in Amazon S3, and is more appropriate for complex queries and large data sets (up to exabytes). Because Amazon Athena and Amazon Redshift share a common data catalog and data formats, you can use them both against the same data sets in Amazon S3.

    Learn more by visiting and

    hashtag
    Data transfer

    AWS provides a portfolio of data transfer services to provide the right solution for any data migration project. The level of connectivity is a major factor in data migration, and AWS has offerings that can address your hybrid cloud storage, online data transfer, and offline data transfer needs.

    Hybrid cloud storage: is a hybrid cloud storage service that lets you seamlessly connect and extend your on-premises applications to AWS Storage. Customers use Storage Gateway to seamlessly replace tape libraries with cloud storage, provide cloud storage-backed file shares, or create a low-latency cache to access data in AWS for on-premises applications.

    Online data transfer: makes it easy and efficient to transfer hundreds of terabytes and millions of files into Amazon S3, up to 10x faster than open-source tools. DataSync automatically handles or eliminates many manual tasks, including scripting copy jobs, scheduling and monitoring transfers, validating data, and optimizing network utilization. Additionally, you can use AWS DataSync to copy objects between a bucket on S3 on Outposts and a bucket stored in an AWS Region. The provides fully managed, simple, and seamless file transfer to Amazon S3 using SFTP, FTPS, and FTP. enables fast transfers of files over long distances between your client and your Amazon S3 bucket.

    Offline data transfer / little or no connectivity: The is purpose-built for use in edge locations where network capacity is constrained or nonexistent and provides storage and computing capabilities in harsh environments. is the smallest, ultra-portable, rugged, and secure device in the AWS Snow Family offering edge computing, data storage, and data transfer on-the-go, in austere environments with little or no connectivity. The service uses ruggedized, portable storage and edge computing devices for data collection, processing, and migration. Customers can ship the physical Snowball device for offline data migration to AWS. is an exabyte-scale data transfer service used to move massive volumes of data to the cloud, including video libraries, image repositories, or even a complete data center migration.

    Customers can also work with third-party providers from the to deploy hybrid storage architectures, integrate Amazon S3 into existing applications and workflows, and transfer data to and from AWS.

    Learn more by visiting , , , , ,

    hashtag
    Data exchange

    accelerates time to insight with direct access to data providers' Amazon S3 data. AWS Data Exchange for Amazon S3 helps you easily find, subscribe to, and use third-party data files for storage cost optimization, simplified data licensing management, and more. It is intended for subscribers who want to easily use third-party data files for data analysis with AWS services without needing to create or manage data copies. It is also helpful for data providers who want to offer in-place access to data hosted in their Amazon S3 buckets.

    Once data subscribers are entitled to an AWS Data Exchange for Amazon S3 dataset, they can start data analysis without having to set up their own S3 buckets, copy data files into those S3 buckets, or pay associated storage fees. Data analysis can be done with AWS services such as Amazon Athena, Amazon SageMaker Feature Store, or Amazon EMR. Subscribers access the same S3 objects that the data provider maintains and are therefore always using the most up-to-date data available, without additional engineering or operational work. Data providers can easily set up AWS Data Exchange for Amazon S3 on top of their existing S3 buckets to share direct access to an entire S3 bucket or specific prefixes and S3 objects. After setup, AWS Data Exchange automatically manages subscriptions, entitlements, billing, and payment.

    hashtag
    Performance

    Amazon S3 provides industry leading performance for cloud object storage. Amazon S3 supports parallel requests, which means you can scale your S3 performance by the factor of your compute cluster, without making any customizations to your application. Performance scales per prefix, so you can use as many prefixes as you need in parallel to achieve the required throughput. There are no limits to the number of prefixes. Amazon S3 performance supports at least 3,500 requests per second to add data and 5,500 requests per second to retrieve data. Each S3 prefix can support these request rates, making it simple to increase performance significantly.

    To achieve this S3 request rate performance you do not need to randomize object prefixes to achieve faster performance. That means you can use logical or sequential naming patterns in S3 object naming without any performance implications. Refer to the and for the most current information about performance optimization for Amazon S3.

    hashtag
    Consistency

    Amazon S3 delivers strong read-after-write consistency automatically for all applications, without changes to performance or availability, without sacrificing regional isolation for applications, and at no additional cost. With , S3 simplifies the migration of on-premises analytics workloads by removing the need to make changes to applications, and reduces costs by removing the need for extra infrastructure to provide strong consistency.

    Any request for S3 storage is strongly consistent. After a successful write of a new object or an overwrite of an existing object, any subsequent read request immediately receives the latest version of the object. S3 also provides strong consistency for list operations, so after a write, you can immediately perform a listing of the objects in a bucket with any changes reflected.

    AWS Global Infrastructure

    • AWS is a cloud computing platform which is globally available.

    • Global infrastructure is a region around the world in which AWS is based. Global infrastructure is a bunch of high-level IT services which is shown below:

    The following are the components that make up the AWS infrastructure:

    • Availability Zones

    • Region

    • Edge locations

    hashtag
    Availability zone as a Data Center

    • An availability zone is a facility that can be somewhere in a country or in a city. Inside this facility, i.e., Data Centre, we can have multiple servers, switches, load balancing, firewalls. The things which interact with the cloud sits inside the data centers.

    • An availability zone can be a several data centers, but if they are close together, they are counted as 1 availability zone.

    hashtag
    Region

    • A region is a geographical area. Each region consists of 2 more availability zones.

    • A region is a collection of data centers which are completely isolated from other regions.

    • A region consists of more than two availability zones connected to each other through links.

    • Availability zones are connected through redundant and isolated metro fibers.

    hashtag
    Edge Locations

    • Edge locations are the endpoints for AWS used for caching content.

    • Edge locations consist of CloudFront, Amazon's Content Delivery Network (CDN).

    • Edge locations are more than regions. Currently, there are over 150 edge locations.

    hashtag
    Regional Edge Cache

    • AWS announced a new type of edge location in November 2016, known as a Regional Edge Cache.

    • Regional Edge cache lies between CloudFront Origin servers and the edge locations.

    • A regional edge cache has a large cache than an individual edge location.

    Cloud Computing

    hashtag
    What is cloud computing?

    Cloud computing is the on-demand delivery of IT resources over the Internet with pay-as-you-go pricing. Instead of buying, owning, and maintaining physical data centers and servers, you can access technology services, such as computing power, storage, and databases, on an as-needed basis from a cloud provider like Amazon Web Services (AWS).

    hashtag
    Who is using cloud computing?

    Organizations of every type, size, and industry are using the cloud for a wide variety of use cases, such as data backup, disaster recovery, email, virtual desktops, software development and testing, big data analytics, and customer-facing web applications. For example, healthcare companies are using the cloud to develop more personalized treatments for patients. Financial services companies are using the cloud to power real-time fraud detection and prevention. And video game makers are using the cloud to deliver online games to millions of players around the world###

    hashtag
    Benefits of cloud computing ?

    Agility The cloud gives you easy access to a broad range of technologies so that you can innovate faster and build nearly anything that you can imagine. You can quickly spin up resources as you need them–from infrastructure services, such as compute, storage, and databases, to Internet of Things, machine learning, data lakes and analytics, and much more.

    You can deploy technology services in a matter of minutes, and get from idea to implementation several orders of magnitude faster than before. This gives you the freedom to experiment, test new ideas to differentiate customer experiences, and transform your business.

    Elasticity With cloud computing, you don’t have to over-provision resources up front to handle peak levels of business activity in the future. Instead, you provision the amount of resources that you actually need. You can scale these resources up or down to instantly grow and shrink capacity as your business needs change.

    Deploy globally in minutes

    With the cloud, you can expand to new geographic regions and deploy globally in minutes. For example, AWS has infrastructure all over the world, so you can deploy your application in multiple physical locations with just a few clicks. Putting applications in closer proximity to end users reduces latency and improves their experience.

    Types of cloud computing ?

    Infrastructure as a Service (IaaS) IaaS contains the basic building blocks for cloud IT. It typically provides access to networking features, computers (virtual or on dedicated hardware), and data storage space. IaaS gives you the highest level of flexibility and management control over your IT resources. It is most similar to the existing IT resources with which many IT departments and developers are familiar.

    Platform as a Service (PaaS) PaaS removes the need for you to manage underlying infrastructure (usually hardware and operating systems), and allows you to focus on the deployment and management of your applications. This helps you be more efficient as you don’t need to worry about resource procurement, capacity planning, software maintenance, patching, or any of the other undifferentiated heavy lifting involved in running your application.

    Software as a Service (SaaS) SaaS provides you with a complete product that is run and managed by the service provider. In most cases, people referring to SaaS are referring to end-user applications (such as web-based email). With a SaaS offering, you don’t have to think about how the service is maintained or how the underlying infrastructure is managed. You only need to think about how you will use that particular software.

    AWS Features

    The following are the features of AWS:

    • Flexibility

    • Cost-effective

    • Scalable and elastic

    • Secure

    • Experienced

    hashtag
    1) Flexibility

    • The difference between AWS and traditional IT models is flexibility.

    • The traditional models used to deliver IT solutions that require large investments in a new architecture, programming languages, and operating system. Although these investments are valuable, it takes time to adopt new technologies and can also slow down your business.

    • The flexibility of AWS allows us to choose which programming models, languages, and operating systems are better suited for their project, so we do not have to learn new skills to adopt new technologies.

    hashtag
    2) Cost-effective

    • Cost is one of the most important factors that need to be considered in delivering IT solutions.

    • For example, developing and deploying an application can incur a low cost, but after successful deployment, there is a need for hardware and bandwidth. Owing our own infrastructure can incur considerable costs, such as power, cooling, real estate, and staff.

    • The cloud provides on-demand IT infrastructure that lets you consume the resources what you actually need. In aws, you are not limited to a set amount of resources such as storage, bandwidth or computing resources as it is very difficult to predict the requirements of every resource. Therefore, we can say that the cloud provides flexibility by maintaining the right balance of resources.

    hashtag
    3) Scalable and elastic

    • In a traditional IT organization, scalability and elasticity were calculated with investment and infrastructure while in a cloud, scalability and elasticity provide savings and improved ROI (Return On Investment).

    • Scalability in aws has the ability to scale the computing resources up or down when demand increases or decreases respectively.

    • Elasticity in aws is defined as the distribution of incoming application traffic across multiple targets such as Amazon EC2 instances, containers, IP addresses, and Lambda functions.

    hashtag
    4) Secure

    • AWS provides a scalable cloud-computing platform that provides customers with end-to-end security and end-to-end privacy.

    • AWS incorporates the security into its services, and documents to describe how to use the security features.

    • AWS maintains confidentiality, integrity, and availability of your data which is the utmost importance of the aws.

    Physical security: Amazon has many years of experience in designing, constructing, and operating large-scale data centers. An aws infrastructure is incorporated in AWS controlled data centers throughout the world. The data centers are physically secured to prevent unauthorized access.

    Secure services: Each service provided by the AWS cloud is secure.

    Data privacy: A personal and business data can be encrypted to maintain data privacy.

    AWS IAM

    hashtag
    What is IAM?

    • IAM stands for Identity Access Management.

    Instance types

    When you launch an instance, the instance type that you specify determines the hardware of the host computer used for your instance. Each instance type offers different compute, memory, and storage capabilities, and is grouped in an instance family based on these capabilities. Select an instance type based on the requirements of the application or software that you plan to run on your instance.

    Amazon EC2 dedicates some resources of the host computer, such as CPU, memory, and instance storage, to a particular instance. Amazon EC2 shares other resources of the host computer, such as the network and the disk subsystem, among instances. If each instance on a host computer tries to use as much of one of these shared resources as possible, each receives an equal share of that resource. However, when a resource is underused, an instance can consume a higher share of that resource while it's available.

    Each instance type provides higher or lower minimum performance from a shared resource. For example, instance types with high I/O performance have a larger allocation of shared resources. Allocating a larger share of shared resources also reduces the variance of I/O performance. For most applications, moderate I/O performance is more than enough. However, for applications that require greater or more consistent I/O performance, consider an instance type with higher I/O performance.

    Amazon RDS on VMware

    Amazon RDS on VMware provides Amazon's relational database service for on-premises VMware infrastructure and points to the potential future of hybrid cloud services.

    Many people used to see VMware and AWS as bitter enemies, but that changed when they announced VMware Cloud on AWS in 2017. The announcement of Amazon RDS on VMware at VMworld 2018 indicated an evolving relationship between the two companies that could point to potential. For greater collaboration between cloud vendors and on-premises infrastructure.

    The investment required to move everything to the cloud has proved too expensive for many organizations, so as realistic expectations are set, more and more cloud vendors will try to integrate the features and benefits of the cloud with their on-premises infrastructure.

    Amazon RDS aims to make it easy to set up, run and develop relational databases. RDS provides a flexible and easy way to do previously tedious tasks like patching, capacity management and database tuning. Because this is an Amazon service, it only offers on-demand pricing for what you use or pay for reserved, dedicated capacity. Until recently, Amazon limited this service to Amazon Cloud.

    AWS Services

    hashtag
    AWS Services overview

    hashtag
    1. Compute

    Burst Duration = (credit Balance) / [(burst IOPS) – 3(Storage size in GB)]
     
    # mysqldump -u user -p[user_password] [database_name] > backupfile.sql
     
    aws rds restore-db-instance-from-s3 \  
    --allocated-storage 125 \ 
    --db-instance-identifier tddbidentifier \
    --db-instance-class db.m4.small \
    --engine mysql \
    --master-user-name masterawsuser \
    --master-user-password masteruserpassword \
    --s3-bucket-name tpbucket \
    --s3-ingestion-role-arn arn:aws:iam::account-number:role/rolename \
    --s3-prefix bucketprefix \
    --source-engine mysql \
    --source-engine-version 5.6.27
    aws rds create-db-instance-read-replica \
        --db-instance-identifier myreadreplica \
        --source-db-instance-identifier mydbinstance
    aws rds create-db-instance-read-replica \
        --db-instance-identifier readreplica_name \
        --region target_region_name
        --db-subnet-group-name subnet_name 
        --source-db-instance-identifier arn:aws:rds:region_name:11323467889012:db:mysql_instance1 
     
    mysqldump -h RDS instance endpoint \
        -u user \
        -p password \
        --port=3306 \
        --single-transaction \
        --routines \
        --triggers \
        --databases  database database2 \
        --compress  \
        --compact | mysql \
            -h MariaDB host \
            -u master user \
            -p password \
            --port 3306 
    kubectl get nodes --show-labels
    NAME      STATUS    ROLES    AGE     VERSION        LABELS
    worker0   Ready     <none>   1d      v1.13.0        ...,disktype=ssd,kubernetes.io/hostname=worker0
    worker1   Ready     <none>   1d      v1.13.0        ...,kubernetes.io/hostname=worker1
    worker2   Ready     <none>   1d      v1.13.0        ...,kubernetes.io/hostname=worker2
    Amazon RDS on VMware is in Technical Preview, so all the details about how the platform works are currently unavailable. If it's anything like the native Amazon RDS, you'll be able to create and manage databases from half a dozen popular database types, including Oracle and Microsoft SQL Server.

    Amazon RDS for VMware will enable the affordable, high-availability hybrid deployment, simple database disaster recovery for AWS, and read-only clones of on-premises data in AWS. This partnership could help Amazon customers easily migrate traditional database deployment from their sites and AWS, even sites with difficult licensing requirements. It can also help VMware customers see the benefits of the AWS management stack for databases in traditional infrastructure.

    hashtag
    Amazon RDS Vs. VMware

    Amazon has focused on moving workloads to the public cloud; Even VMware Cloud on AWS has focused on moving older workloads off-premises. Amazon RDS on VMware is different. With this release, Amazon is following Microsoft to provide public cloud services within the confines of the data centre.

    Let's say Amazon continues to add its services to the data centre and continues to do the same with Microsoft Azure Stack. In that case, customers can see several major cloud benefits without the enormous effort of moving workloads to the public cloud. As much as the industry has talked about hybrid cloud, most customers haven't implemented it.

    It takes a major investment for customers to achieve the flexibility, ease of consumption, agility and scale of the public cloud. Instead of making that investment, organizations often just put the time and effort into moving particular workloads to the cloud. As cloud providers look to expand the public cloud into a private data centre, customers can get the best of both worlds and have a true hybrid cloud model.

    The ability to run Amazon services inside your data centre is all but Amazon admitting that the public cloud isn't the only way forward. Combine that with the fact that you can now run a traditional VMware on-premises infrastructure inside Amazon's public cloud, and you can see that the two companies have decided to have public, private, and hybrid clouds that all coexist.

    S3 Batch Operationsarrow-up-right
    watching the video tutorialsarrow-up-right
    S3 Replicationarrow-up-right
    S3 Cross-Region Replication (CRR)arrow-up-right
    S3 Same-Region Replication (SRR)arrow-up-right
    S3 Batch Replicationarrow-up-right
    Amazon S3 Replication Time Control (S3 RTC)arrow-up-right
    S3 Multi-Region Access Pointsarrow-up-right
    S3 Multi-Region Access Points failover controlsarrow-up-right
    S3 Object Lockarrow-up-right
    S3 storage managementarrow-up-right
    monitoring »arrow-up-right
    S3 Storage Lensarrow-up-right
    storage analytics and insights page.arrow-up-right
    storage analytics and insights pagearrow-up-right
    S3 Storage Classesarrow-up-right
    S3 Storage Class Analysisarrow-up-right
    S3 Lifecycle management »arrow-up-right
    S3 Access Pointsarrow-up-right
    storage managementarrow-up-right
    S3 Block Public Accessarrow-up-right
    S3 Object Ownershiparrow-up-right
    Amazon S3 server access logsarrow-up-right
    AWS CloudTrailarrow-up-right
    IAM Access Analyzer for S3arrow-up-right
    Refining Permissions Using Last Accessed Dataarrow-up-right
    Amazon Maciearrow-up-right
    AWS PrivateLink for S3arrow-up-right
    S3 access management and securityarrow-up-right
    protecting data in Amazon S3 »arrow-up-right
    S3 Object Lambdaarrow-up-right
    building big data storage solutionsarrow-up-right
    S3 Select »arrow-up-right
    AWS Storage Gatewayarrow-up-right
    AWS DataSyncarrow-up-right
    AWS Transfer Familyarrow-up-right
    Amazon S3 Transfer Accelerationarrow-up-right
    AWS Snow Familyarrow-up-right
    AWS Snowconearrow-up-right
    AWS Snowballarrow-up-right
    AWS Snowmobilearrow-up-right
    AWS Partner Network (APN)arrow-up-right
    AWS cloud data migration services »arrow-up-right
    AWS Storage Gateway »arrow-up-right
    AWS DataSync »arrow-up-right
    AWS Transfer Family »arrow-up-right
    Amazon S3 Transfer Acceleration »arrow-up-right
    AWS Snow Family »arrow-up-right
    AWS Data Exchange for Amazon S3arrow-up-right
    Performance Guidelines for Amazon S3arrow-up-right
    Performance Design Patterns for Amazon S3arrow-up-right
    S3 Strong Consistencyarrow-up-right
    Regional Edge Caches

    Edge location is not a region but a small location that AWS have. It is used for caching the content.

  • Edge locations are mainly located in most of the major cities to distribute the content to end users with reduced latency.

  • For example, some user accesses your website from Singapore; then this request would be redirected to the edge location closest to Singapore where cached data can be read.

  • Data is removed from the cache at the edge location while the data is retained at the Regional Edge Caches.

  • When the user requests the data, then data is no longer available at the edge location. Therefore, the edge location retrieves the cached data from the Regional edge cache instead of the Origin servers that have high latency.

  • 4. Kube Controller Managerarrow-up-right

  • 5. Cloud Controller Manager (CCM)arrow-up-right

  • 3. Container Runtimearrow-up-right
    How is communication between the control plane and worker nodes secured in Kubernetes?arrow-up-right
  • What is the purpose of the etcd key-value store in Kubernetes?arrow-up-right

  • What happens to Kubernetes applications if etcd goes down?arrow-up-right

  • Kubernetes Control Plane Componentsarrow-up-right
    1. kube-apiserverarrow-up-right
    2. etcdarrow-up-right
    Kubernetes Worker Node Componentsarrow-up-right
    1. Kubeletarrow-up-right
    2. Kube proxyarrow-up-right
    Kubernetes Cluster Addon Componentsarrow-up-right
    1. CNI Pluginarrow-up-right
    Kubernetes Architecture FAQsarrow-up-right
    What is the main purpose of the Kubernetes control plane?arrow-up-right
    What is the purpose of the worker nodes in a Kubernetes cluster?arrow-up-right
    Conclusionarrow-up-right
    BboltDBarrow-up-right
    using gRPCarrow-up-right
    gRPC gatewayarrow-up-right
    scheduling pluginsarrow-up-right
    Kubernetes pod priority guidearrow-up-right
    pluggable scheduling frameworkarrow-up-right
    Kubernetes Jobsarrow-up-right
    service accountsarrow-up-right
    3. kube-schedulerarrow-up-right

    Flexibility means that migrating legacy applications to the cloud is easy, and cost-effective. Instead of re-writing the applications to adopt new technologies, you just need to move the applications to the cloud and tap into advanced computing capabilities.

  • Building applications in aws are like building applications using existing hardware resources.

  • The larger organizations run in a hybrid mode, i.e., some pieces of the application run in their data center, and other portions of the application run in the cloud.

  • The flexibility of aws is a great asset for organizations to deliver the product with updated technology in time, and overall enhancing the productivity.

  • AWS provides no upfront investment, long-term commitment, or minimum spend.

  • You can scale up or scale down as the demand for resources increases or decreases respectively.

  • An aws allows you to access the resources more instantly. It has the ability to respond the changes more quickly, and no matter whether the changes are large or small, means that we can take new opportunities to meet the business challenges that could increase the revenue, and reduce the cost.

  • Elasticity load balancing and scalability automatically scale your AWS computing resources to meet unexpected demand and scale down automatically when demand decreases.

  • The aws cloud is also useful for implementing short-term jobs, mission-critical jobs, and the jobs repeated at the regular intervals.

  • Amazon RDS for Oracle
  • Amazon RDS for SQL Server

  • Amazon RDS for Oracle
  • Amazon RDS for SQL Server

    • Up to 2x faster transaction commits compared to Amazon RDS Multi-AZ with one standby

    Automatic failover duration

    • Not available: a user, a user-initiated point-in-time-restore operation will be required.

    • This operation can take several hours to complete

    • Any data updates that occurred after the latest restorable time (typically within the last 5 minutes) will not be available

    • A new primary is available to serve your new workload in as quickly as 60 seconds

    • Failover time is independent of write throughput

    • A new primary is available to serve your new workload in typically under 35 seconds

    • Failover time depends on length of replica lag

    Higher resiliency to AZ outage

    • None: in the event of an AZ failure, your risk data loss and hours of failover time

    • In the event of an AZ failure, your workload will automatically failover to the up-to-date standby

    • In the event of a failure, one of the two remaining standbys will takeover and serve the workload (writes) from the primary

    Lower jitter for transaction commits

    • No optimization for jitter

    • Sensitive to impairments on the write path

    • Uses the 2-of-3 write quorum: insensitive to up to one impaired write path

    IAM allows you to manage users and their level of access to the aws console.
  • It is used to set users, permissions and roles. It allows you to grant access to the different parts of the aws platform.

  • AWS Identity and Access Management is a web service that enables Amazon Web Services (AWS) customers to manage users and user permissions in AWS.

  • With IAM, Organizations can centrally manage users, security credentials such as access keys, and permissions that control which AWS resources users can access.

  • Without IAM, Organizations with multiple users must either create multiple user accounts, each with its own billing and subscriptions to AWS products or share an account with a single security credential. Without IAM, you also don't have control about the tasks that the users can do.

  • IAM enables the organization to create multiple users, each with its own security credentials, controlled and billed to a single aws account. IAM allows the user to do only what they need to do as a part of the user's job.

  • hashtag
    Features of IAM

    • Centralised control of your AWS account: You can control creation, rotation, and cancellation of each user's security credentials. You can also control what data in the aws system users can access and how they can access.

    • Shared Access to your AWS account: Users can share the resources for the collaborative projects.

    • Granular permissions: It is used to set a permission that user can use a particular service but not other services.

    • Identity Federation: An Identity Federation means that we can use Facebook, Active Directory, LinkedIn, etc with IAM. Users can log in to the AWS Console with same username and password as we log in with the Active Directory, Facebook, etc.

    • Multifactor Authentication: An AWS provides multifactor authentication as we need to enter the username, password, and security check code to log in to the AWS Management Console.

    • Permissions based on Organizational groups: Users can be restricted to the AWS access based on their job duties, for example, admin, developer, etc.

    • Networking controls: IAM also ensures that the users can access the AWS resources within the organization's corporate network.

    • Provide temporary access for users/devices and services where necessary: If you are using a mobile app and storing the data in AWS account, you can do this only when you are using temporary access.

    • Integrates with many different aws services: IAM is integrated with many different aws services.

    • Supports PCI DSS Compliance: PCI DSS (Payment Card Industry Data Security Standard) is a compliance framework. If you are taking credit card information, then you need to pay for compliance with the framework.

    • Eventually Consistent: IAM service is eventually consistent as it achieves high availability by replicating the data across multiple servers within the Amazon's data center around the world.

    • Free to use: AWS IAM is a feature of AWS account which is offered at no additional charge. You will be charged only when you access other AWS services by using IAM user.

    hashtag
    What is SAML?

    • SAML stands for Security Assertion Markup language.

    • Generally, users need to enter a username and password to login in any application.

    • SAML is a technique of achieving Single Sign-On (SSO).

    • Security Assertion Markup Language (SAML) is an Xml-based framework that allows the identity providers to provide the authorization credentials to the service provider.

    • With SAML, you need to enter one security attribute to log in to the application

    • SAML is a link between the authentication of the user's identity and authorization to use a service.

    • SAML provides a service known as Single Sign-On means that users have to log in once and can use the same credentials to log in to another service provider.

    hashtag
    Why SAML?

    • With SAML, both the service provider and identity provider exist separately, but centralizes the user management and provides access to the SaaS solutions.

    • SAML authentication is mainly used for verifying the user's credentials from the identity provider.

    hashtag
    Advantages of SAML:

    • SAML SSO (SINGLE SIGN-ON): SAML provides security by eliminating passwords for an app and replacing them with the security tokens. Since we do not require any passwords for SAML logins, there is no risk of credentials to be stolen by unauthorized users. It provides faster, easier and trusted access to cloud applications.

    • Open Standard SINGLE SIGN-ON: SAML implementations confirms to the open standard. Therefore, it is not restricted to a single identity provider. This open standard allows you to choose the SAML provider.

    • Strong Security: SAML uses federated identities and secure tokens to make SAML one of the best secure forms for web-based authentication.

    • Improved online experience for end users: SAML provides SINGLE SIGN-ON (SSO) to authenticate at an identity provider, and the identity provider sends the authentication to the service provider without additional credentials.

    • Reduced administrative costs for service providers: Using single authentication multiple times for multiple services can reduce the administrative costs for maintaining the account information.

    • Risk transference: SAML has put the responsibility of handling the identities to the identity provider.

    hashtag
    Types of SAML providers

    SAML provider is an entity within a system that helps the user to access the services that he or she wants.

    There are two types of SAML providers:

    • Service provider

    • Identity provider

    hashtag
    Service provider

    • It is an entity within a system that provides the services to the users for which they are authenticated.

    • Service provider requires the authentication from the identity provider that grants the access to the user.

    • Salesforce and other CRM are the common service providers.

    hashtag
    Identity provider

    • An identity provider is an entity within a system that sends the authentication to the service provider is about who they are along with the user access rights.

    • It maintains a directory of the user and provides an authentication mechanism.

    • Microsoft Active Directory and Azure are the common identity providers.

    hashtag
    What is a SAML Assertion?

    A SAML Assertion is an XML document that the identity provider sends to the service provider containing user authorization.

    SAML Assertion is of three types:

    • Authentication

      • It proves the identification of the user

      • It provides the time at which the user logged in.

      • It also determines which method of authentication has been used.

    • Attribute

      • An attribute assertion is used to pass the SAML attributes to the service provider where attribute contains a piece of data about the user authentication.

    • Authorization decision

      • An authorization decision determines whether the user is authorized to use the service or identity provider denied the request due to the password failure.

    hashtag
    Working of SAML

    • If a user tries to access the resource on the server, the service provider checks whether the user is authenticated within the system or not. If you are, you skip to step 7, and if you are not, the service provider starts the authentication process.

    • The service provider determines the appropriate identity provider for you and redirects the request to the identity provider.

    • An authentication request has been sent to the SSO (SINGLE SIGN-ON) service, and SSO service identifies you.

    • The SSO service returns with an XHTML document, which contains authentic information required by the service provider in a SAMLResponse parameter.

    • The SAMLResponse parameter is passed to the Assertion Consumer Service (ACS) at the service provider.

    • The service provider processes the request and creates a security context; you automatically logged in.

    • After login, you can request for a resource that you want.

    • Finally, the resource is returned to you.

    hashtag
    IAM Identities

    IAM identities are created to provide authentication for people and processes in your aws account.

    IAM identities are categorized as given below:

    hashtag
    AWS Account Root User

    • When you first create an AWS account, you create an account as a root user identity which is used to sign in to AWS.

    • You can sign to the AWS Management Console by entering your email address and password. The combination of email address and password is known as root user credentials.

    • When you sign in to AWS account as a root user, you have unrestricted access to all the resources in AWS account.

    • The Root user can also access the billing information as well as can change the password also.

    hashtag
    What is a Role?

    • A role is a set of permissions that grant access to actions and resources in AWS. These permissions are attached to the role, not to an IAM User or a group.

    • An IAM User can use a role in the same AWS account or a different account.

    • An IAM User is similar to an IAM User; role is also an AWS identity with permission policies that determine what the identity can and cannot do in AWS.

    • A role is not uniquely associated with a single person; it can be used by anyone who needs it.

    • A role does not have long term security credential, i.e., password or security key. Instead, if the user uses a role, temporarily security credentials are created and provided to the user.

    • You can use the roles to delegate access to users, applications or services that generally do not have access to your AWS resources.

    hashtag
    Situations in which "IAM Roles" can be used:

    • Sometimes you want to grant the users to access the AWS resources in your AWS account.

    • Sometimes you want to grant the users to access the AWS resources in another AWS account.

    • It also allows the mobile app to access the AWS resources, but not want to store the keys in the app.

    • It can be used to grant access to the AWS resources which have identities outside of AWS.

    • It can also be used to grant access to the AWS resources to the third party so that they can perform an audit on AWS resources.

    hashtag
    Following are the important terms associated with the "IAM Roles":

    • Delegation: Delegation is a process of granting the permissions to the user to allow the access to the AWS resources that you control. Delegation sets up the trust between a trusted account (an account that owns the resource) and a trusting account (an account that contains the users that need to access the resources). The trusting and trusted account can be of three types:

      • Same account

      • Two different accounts under the same organization control

      • Two different accounts owned by different organizations.

    To delegate permission to access the resources, an IAM role is to be created in the trusting account that has the two policies attached.

    Permission Policy: It grants the user with a role the needed permissions to carry out the intended tasks.

    Trust Policy: It specifies which trusted account members can use the role.

    • Federation: Federation is a process of creating the trust relationship between the external service provider and AWS. For example, Facebook allows the user to login to different websites by using their facebook accounts.

    • Trust policy: A document was written in JSON format to define who is allowed to use the role. This document is written based on the rules of the IAM Policy Language.

    • Permissions policy: A document written in JSON format to define the actions and resources that the role can use. This document is based on the rules of the IAM Policy Language.

    • Permissions boundary: It is an advanced feature of AWS in which you can limit the maximum permissions that the role can have. The permission boundaries can be applied to IAM User or IAM role but cannot be applied to the service-linked role.

    • Principal: A principal can be AWS root account user, an IAM User, or a role. The permissions that can be granted in one of the two ways:

      • Attach a permission policy to a role.

      • The services that support resource-based policies, you can identify the principal in the principal element of policy attached to the resource.

    • Cross-account access: Roles vs Resource-Based Policies: It allows you to grant access to the resources in one account to the trusted principal in another account is known as cross-account access. Some services allow you to attach the policy directly, known as Resource-Based policy. The services that support Resource-Based Policy are Amazon S3 buckets, Amazon SNS, Amazon SQS Queues.

    hashtag
    IAM Roles Use Cases

    There are two ways to use the roles:

    • IAM Console: When IAM Users working in the IAM Console and want to use the role, then they access the permissions of the role temporarily. An IAM Users give up their original permissions and take the permissions of the role. When IAM User exits the role, their original permissions are restored.

    • Programmatic Access: An AWS service such as Amazon EC2 instance can use role by requesting temporary security credentials using the programmatic requests to AWS.

    An IAM Role can be used in the following ways:

    • IAM User: IAM Roles are used to grant the permissions to your IAM Users to access AWS resources within your own or different account. An IAM User can use the permissions attached to the role using the IAM Console. A Role also prevents the accidental access to the sensitive AWS resources.

    • Applications and Services: You can grant the access of permissions attached with a role to applications and services by calling the AssumeRole API function. The AssumeRole function returns a temporary security credentials associated with a role. An application and services can only take those actions which are permitted by the role. An application cannot exit the role in the way the IAM User in Console does, rather it stops using with the temporary credentials and resumes its original credentials.

    • Federated Users: Federated Users can sign in using the temporary credentials provided by an identity provider. AWS provides an IDP (identity provider) and temporary credentials associated with the role to the user. The credentials grant the access of permissions to the user.

    Following are the cases of Roles:

    • Switch to a role as an IAM User in one AWS account to access resources in another account that you own.

      • You can grant the permission to your IAM Users to switch roles within your AWS account or different account. For example, you have Amazon EC2 instances which are very critical to your organization. Instead of directly granting permission to users to terminate the instances, you can create a role with the privileges that allows the administrators to switch to the role when they need to terminate the instance.

      • You have to grant users permission to assume the role explicitly.

      • Multi-factor authentication role can be added to the role so that only users who sign in with the MFA can use the role.

      • Roles prevent accidental changes to the sensitive resource, especially if you combine them with the auditing so that the roles can only be used when needed.

      • An IAM User in one account can switch to the role in a same or different account. With roles, a user can access the resources permitted by the role. When user switch to the role, then their original permissions are taken away. If a user exits the role, their original permissions are restored.

    • Providing access to an AWS service

      • AWS services use roles to access a AWS resources.

      • Each service is different in how it uses roles and how the roles are assigned to the service.

    • Providing access to externally authenticated users. Sometimes users have identities outside of AWS such as in your corporate directory. If such users want to work with the AWS resources, then they should know the security credentials. In such situations, we can use a role to specify the permissions for a third-party identity provider (IDP).

      • SAML -based federation SAML 2.0 (Security Assertion Markup Language 2.0) is an open framework that many identity providers use. SAML provides the user with the federated single-sign-on to the AWS Management Console, so that user can log in to the AWS Management Console. How SAML-based federation works

    • Providing access to third parties When third parties want to access the AWS resources, then you can use roles to delegate access to them. IAM roles grant these third parties to access the AWS resources without sharing any security credentials. Third parties provide the following information to create a role:

      • The third party provides the account ID that contains the IAM Users to use your role. You need to specify AWS account ID as the principal when you define the trust policy for the role.

      • The external ID of the third party is used to associate with the role. You specify the external ID to define the trust policy of the role.

    hashtag
    Creating IAM Roles

    hashtag
    Creating IAM Roles for a service

    Creating a Role for a service using the AWS Management Console.

    • In the navigation pane of the console, click Roles and then click on "Create Role". The screen appears shown below on clicking Create Role button.

    • Choose the service that you want to use with the role.

    • Select the managed policy that attaches the permissions to the service.

    • In a role name box, enter the role name that describes the role of the service, and then click on "Create role".

    Creating a Role for a service using the CLI (Command Line Interface)

    • Creating a role using the console, many of the steps are already done for you, but with the CLI you explicitly perform each step yourself. You must create a policy, and assign a permission policy to the role. To create a role for an AWS service using the AWS CLI, use the following commands:

      • Create a role: aws iam create-role

      • Attach a permission policy to the role: aws iam put-role-policy

    • If you are using a role with instance such as Amazon EC2 instance, then you need to create an instance profile to store a role. An instance profile is a container of role, but instance profile can contain only one role. If you create the role by using AWS Management Console, then instance profile is already created for you. If you create the profile using CLI, you must explicitly specify each step yourself. To create an instance profile using CLI, use the following commands:

      • Create an instance profile: aws iam create-instance-profile

      • Add a role to instance profile: aws iam add-role-to-instance-profile

    hashtag
    Creating IAM Roles for an IAM User

    Creating a Role for an IAM User using AWS Management Console

    • In the navigation pane of the console, click Roles and then click on "Create Role". The screen appears shown below on clicking Create Role button.

    • Specify the account ID that you want to grant the access to the resources, and then click on Next Permissions button.

    • If you selected the option "Require external ID" means that it allows the users from the third party to access the resources. You need to enter the external ID provided by the administrator of the third party. This condition is automatically added to the trust policy that allows the user to assume the role.

    • If you selected the option "Require MFA" is used to restrict the role to the users who provide Multi-factor authentication.

    • Select a policy that you want to attach with the role. A policy contains the permissions that specify the actions that they can take and resources that they can access.

    • In a role name box, enter the role name and the role description.

    • Click on Create role to complete the creation of the role.

    Creating a Role for an IAM User using CLI (Command Line Interface)

    Backward Skip 10sPlay VideoForward Skip 10s

    When you use the console to create a role, many of the steps are already done for you. In the case of CLI, you must specify each step explicitly.

    To create a role for cross-account access using CLI, use the following commands:

    • Create a role: aws iam create-role

    • Attach a permission policy to the role: aws iam put-role-policy

    hashtag
    Creating IAM Roles for a Third Party Identity Provider (Federation)

    Identity Federation allows you to access AWS resources for users who can sign in using third-party identity provider. To configure Identity Federation, you must configure the identity provider and then create an IAM Role that determines the permissions which federated users can have.

    • Web Identity Federation: Web Identity Federation provides access to the AWS resources which have signed in with the login with facebook, Google, Amazon or another Open ID standard. To configure with the Web Identity Federation, you must first create and configure the identity provider and then create the IAM Role that determines the permissions that federated users will have.

    • Security Assertion Markup Language (SAML) 2.0 Federation: SAML-Based Federation provides access to the AWS resources in an organization that uses SAML. To configure SAML 2.0 Based Federation, you must first create and configure the identity provider and then create the IAM Role that determines the permissions the federated users from the organization will have.

    Creating a Role for a web identity using AWS Management Console

    • Open the IAM Console at https://console.aws.amazon.com/iam/

    • In the navigation pane, click Roles and then click on Create role.

    • After clicking on the create role, select the type of trusted entity, i.e., web identity

    • Specify the client ID that identifies your application.

      • If you are creating a role for Amazon Cognity, specify the ID of the identity pool when you have created your Amazon Cognito applications into the identity Pool ID box.

      • If you are creating a role for a single web identity provider, specify the ID that the provider provides when you have registered your application with the identity provider.

    • (Optional) Click Add Conditions to add the additional conditions that must be met before users of your application can use the permissions granted by the role.

    • Now, attach the permission policies to the role and then click Next: Tags.

    • In a role name box, specify the role name and role description

    • Click Create role to complete the process of creation of role.

    Creating a Role for SAML Based 2.0 Federation using AWS Management Console

    • Open the IAM Console at https://console.aws.amazon.com/iam/

    • In the navigation pane of the console, Click Roles and then click on Create role

    • Click on Role for Identity Provider Access.

    • Select the type of the role that you want to create for Grant Web Single Sign-On (SSO) or Grant API access.

    • Select the SAML Provider for which you want to create the role.

    • If you are creating a role for API access, select the attribute from the attribute list. Then in the value box, enter the value that you want to include in the role. It restricts the access to the role to the users from the identity providers whose SAML authentication response includes the attributes you select.

    • If you want to add more attribute related conditions, click on Add Conditions.

    • Attach the permission policies to the role.

    • Click Create role to complete the process of creation of role.

    Creating a role for Federated Users using AWS CLI

    To create a role for federated users using AWS CLI, use the following commands:

    Create a role: aws iam create-role

    hashtag
    Instance type names

    Amazon EC2 provides a variety of instance types so you can choose the type that best meets your requirements. Instance types are named based on their family, generation, additional capabilities, and size. The first position of the instance type name indicates the instance family, for example c. The second position indicates the instance generation, for example 5. The remaining letters before the period indicate additional capabilities, such as instance store volumes. After the period (.) is the instance size, which is either a number followed by a size, such as 9xlarge, or metal for bare metal instances.

    The following are the additional capabilities indicated by the instance type names:

    • a – AMD processors

    • g – AWS Graviton processors

    • i – Intel processors

    • d – Instance store volumes

    • n – Network optimization

    • b – Block storage optimization

    • e – Extra storage or memory

    • z – High frequency

    Contents

    • Available instance typesarrow-up-right

    • Hardware specificationsarrow-up-right

    • AMI virtualization typesarrow-up-right

    hashtag
    Available instance types

    Amazon EC2 provides a wide selection of instance types optimized to fit different use cases. Instance types comprise varying combinations of CPU, memory, storage, and networking capacity and give you the flexibility to choose the appropriate mix of resources for your applications. Each instance type includes one or more instance sizes, allowing you to scale your resources to the requirements of your target workload.

    Note

    Previous generation instances are still fully supported and retain the same features and functionality. We encourage you to use the latest generation of instances to get the best performance.

    To determine which instance types meet your requirements, such as supported Regions, compute resources, or storage resources, see Find an Amazon EC2 instance typearrow-up-right.

    Topics

    • Current generation instancesarrow-up-right

    • Previous generation instancesarrow-up-right

    hashtag
    Current generation instances

    For the best performance, we recommend that you use the following instance types when you launch new instances. For more information, see Amazon EC2 Instance Typesarrow-up-right.

    Sixth and seventh generation of Amazon EC2 instances

    Sixth and seventh generation instances include:

    • General purpose: M6a, M6g, M6gd, M6i, M6id, M6idn, M6in, M7g, T4g

    • Computer optimized: C6a, C6g, C6gd, C6gn, C6i, C6id, C6in, C7g, Hpc6a

    • Memory optimized: Hpc6id, R6a, R6g, R6gd, R6i, R6id, R6idn, R6in, R7g, X2gd, X2idn, X2iedn

    • Storage optimized: I4i, Im4gn, Is4gen

    • Accelerated computing: G5g, Trn1

    Instances

    • General purposearrow-up-right

    • Compute optimizedarrow-up-right

    • Memory optimizedarrow-up-right

    General purpose

    Type
    Sizes

    M4

    m4.large | m4.xlarge | m4.2xlarge | m4.4xlarge | m4.10xlarge | m4.16xlarge

    M5

    m5.large | m5.xlarge | m5.2xlarge | m5.4xlarge | m5.8xlarge | m5.12xlarge | m5.16xlarge | m5.24xlarge | m5.metal

    M5a

    m5a.large | m5a.xlarge | m5a.2xlarge | m5a.4xlarge | m5a.8xlarge | m5a.12xlarge | m5a.16xlarge | m5a.24xlarge

    M5ad

    m5ad.large | m5ad.xlarge | m5ad.2xlarge | m5ad.4xlarge | m5ad.8xlarge | m5ad.12xlarge | m5ad.16xlarge | m5ad.24xlarge

    M5d

    m5d.large | m5d.xlarge | m5d.2xlarge | m5d.4xlarge | m5d.8xlarge | m5d.12xlarge | m5d.16xlarge | m5d.24xlarge | m5d.metal

    Compute optimized

    Type
    Sizes

    C4

    c4.large | c4.xlarge | c4.2xlarge | c4.4xlarge | c4.8xlarge

    C5

    c5.large | c5.xlarge | c5.2xlarge | c5.4xlarge | c5.9xlarge | c5.12xlarge | c5.18xlarge | c5.24xlarge | c5.metal

    C5a

    c5a.large | c5a.xlarge | c5a.2xlarge | c5a.4xlarge | c5a.8xlarge | c5a.12xlarge | c5a.16xlarge | c5a.24xlarge

    C5ad

    c5ad.large | c5ad.xlarge | c5ad.2xlarge | c5ad.4xlarge | c5ad.8xlarge | c5ad.12xlarge | c5ad.16xlarge | c5ad.24xlarge

    C5d

    c5d.large | c5d.xlarge | c5d.2xlarge | c5d.4xlarge | c5d.9xlarge | c5d.12xlarge | c5d.18xlarge | c5d.24xlarge | c5d.metal

    Memory optimized

    Type
    Sizes

    CR1

    cr1.8xlarge

    Hpc6id

    hpc6id.32xlarge

    R4

    r4.large | r4.xlarge | r4.2xlarge | r4.4xlarge | r4.8xlarge | r4.16xlarge

    R5

    r5.large | r5.xlarge | r5.2xlarge | r5.4xlarge | r5.8xlarge | r5.12xlarge | r5.16xlarge | r5.24xlarge | r5.metal

    R5a

    r5a.large | r5a.xlarge | r5a.2xlarge | r5a.4xlarge | r5a.8xlarge | r5a.12xlarge | r5a.16xlarge | r5a.24xlarge

    Storage optimized

    Type
    Sizes

    D2

    d2.xlarge | d2.2xlarge | d2.4xlarge | d2.8xlarge

    D3

    d3.xlarge | d3.2xlarge | d3.4xlarge | d3.8xlarge

    D3en

    d3en.xlarge | d3en.2xlarge | d3en.4xlarge | d3en.6xlarge | d3en.8xlarge | d3en.12xlarge

    H1

    h1.2xlarge | h1.4xlarge | h1.8xlarge | h1.16xlarge

    HS1

    hs1.8xlarge

    Accelerated computing

    Type
    Sizes

    DL1

    dl1.24xlarge

    F1

    f1.2xlarge | f1.4xlarge | f1.16xlarge

    G3

    g3.4xlarge | g3.8xlarge | g3.16xlarge

    G4ad

    g4ad.xlarge | g4ad.2xlarge | g4ad.4xlarge | g4ad.8xlarge | g4ad.16xlarge

    G4dn

    g4dn.xlarge | g4dn.2xlarge | g4dn.4xlarge | g4dn.8xlarge | g4dn.12xlarge | g4dn.16xlarge | g4dn.metal

    hashtag
    Previous generation instances

    Amazon Web Services offers previous generation instance types for users who have optimized their applications around them and have yet to upgrade. We encourage you to use current generation instance types to get the best performance, but we continue to support the following previous generation instance types. For more information about which current generation instance type would be a suitable upgrade, see Previous Generation Instancesarrow-up-right.

    Type
    Sizes

    A1

    a1.medium | a1.large | a1.xlarge | a1.2xlarge | a1.4xlarge | a1.metal

    C1

    c1.medium | c1.xlarge

    C3

    c3.large | c3.xlarge | c3.2xlarge | c3.4xlarge | c3.8xlarge

    G2

    g2.2xlarge | g2.8xlarge

    I2

    i2.xlarge | i2.2xlarge | i2.4xlarge | i2.8xlarge

    hashtag
    Hardware specifications

    For more information, see Amazon EC2 Instance Typesarrow-up-right.

    To determine which instance type best meets your needs, we recommend that you launch an instance and use your own benchmark application. Because you pay by the instance second, it's convenient and inexpensive to test multiple instance types before making a decision. If your needs change, even after you make a decision, you can change the instance type later. For more information, see Change the instance typearrow-up-right.

    hashtag
    Processor features

    Intel processor features

    Amazon EC2 instances that run on Intel processors may include the following features. Not all of the following processor features are supported by all instance types. For detailed information about which features are available for each instance type, see Amazon EC2 Instance Types.arrow-up-right

    • Intel AES New Instructions (AES-NI) — Intel AES-NI encryption instruction set improves upon the original Advanced Encryption Standard (AES) algorithm to provide faster data protection and greater security. All current generation EC2 instances support this processor feature.

    • Intel Advanced Vector Extensions (Intel AVX, Intel AVX2, and Intel AVX-512) — Intel AVX and Intel AVX2 are 256-bit, and Intel AVX-512 is a 512-bit instruction set extension designed for applications that are Floating Point (FP) intensive. Intel AVX instructions improve performance for applications like image and audio/video processing, scientific simulations, financial analytics, and 3D modeling and analysis. These features are only available on instances launched with HVM AMIs.

    • Intel Turbo Boost Technology — Intel Turbo Boost Technology processors automatically run cores faster than the base operating frequency.

    • Intel Deep Learning Boost (Intel DL Boost) — Accelerates AI deep learning use cases. The 2nd Gen Intel Xeon Scalable processors extend Intel AVX-512 with a new Vector Neural Network Instruction (VNNI/INT8) that significantly increases deep learning inference performance over previous generation Intel Xeon Scalable processors (with FP32) for image recognition/segmentation, object detection, speech recognition, language translation, recommendation systems, reinforcement learning, and more. VNNI may not be compatible with all Linux distributions.

      The following instances support VNNI: M5n, R5n, M5dn, M5zn, R5b, R5dn, D3

    Confusion may result from industry naming conventions for 64-bit CPUs. Chip manufacturer Advanced Micro Devices (AMD) introduced the first commercially successful 64-bit architecture based on the Intel x86 instruction set. Consequently, the architecture is widely referred to as AMD64 regardless of the chip manufacturer. Windows and several Linux distributions follow this practice. This explains why the internal system information on an instance running Ubuntu or Windows displays the CPU architecture as AMD64 even though the instances are running on Intel hardware.

    hashtag
    AMI virtualization types

    The virtualization type of your instance is determined by the AMI that you use to launch it. Current generation instance types support hardware virtual machine (HVM) only. Some previous generation instance types support paravirtual (PV) and some AWS Regions support PV instances. For more information, see Linux AMI virtualization typesarrow-up-right.

    For best performance, we recommend that you use an HVM AMI. In addition, HVM AMIs are required to take advantage of enhanced networking. HVM virtualization uses hardware-assist technology provided by the AWS platform. With HVM virtualization, the guest VM runs as if it were on a native hardware platform, except that it still uses PV network and storage drivers for improved performance.

    hashtag
    Instances built on the Nitro System

    The Nitro System is a collection of hardware and software components built by AWS that enable high performance, high availability, and high security. For more information, see AWS Nitro Systemarrow-up-right.

    The Nitro System provides bare metal capabilities that eliminate virtualization overhead and support workloads that require full access to host hardware. Bare metal instances are well suited for the following:

    • Workloads that require access to low-level hardware features (for example, Intel VT) that are not available or fully supported in virtualized environments

    • Applications that require a non-virtualized environment for licensing or support

    Nitro components

    The following components are part of the Nitro System:

    • Nitro card

      • Local NVMe storage volumes

      • Networking hardware support

      • Management

      • Monitoring

      • Security

    • Nitro security chip, integrated into the motherboard

    • Nitro hypervisor - A lightweight hypervisor that manages memory and CPU allocation and delivers performance that is indistinguishable from bare metal for most workloads.

    hashtag
    Virtualized instances

    The following virtualized instances are built on the Nitro System:

    • General purpose: A1, M5, M5a, M5ad, M5d, M5dn, M5n, M5zn, M6a, M6g, M6gd, M6i, M6id, M6idn, M6in, M7g, T3, T3a, and T4g

    • Compute optimized: C5, C5a, C5ad, C5d, C5n, C6a, C6g, C6gd, C6gn, C6i, C6id, C6in, C7g, and Hpc6a

    • Memory optimized: Hpc6id, R5, R5a, R5ad, R5b, R5d, R5dn, R5n, R6a, R6g, R6gd, R6i, R6idn, R6in, R6id, R7g, U-3tb1, U-6tb1, U-9tb1, U-12tb1, X2gd, X2idn, X2iedn, X2iezn, and z1d

    • Storage optimized: D3, D3en, I3en, I4i, Im4gn, and Is4gen

    • Accelerated computing: DL1, G4ad, G4dn, G5, G5g, Inf1, Inf2, P3dn, P4d, P4de, Trn1, Trn1n, and VT1

    hashtag
    Bare metal instances

    The following bare metal instances are built on the Nitro System:

    • General purpose: a1.metal | m5.metal | m5d.metal | m5dn.metal | m5n.metal | m5zn.metal | m6a.metal | m6g.metal | m6gd.metal | m6i.metal | m6id.metal | m6idn.metal | m6in.metal | m7g.metal | mac1.metal | mac2.metal

    • Compute optimized: c5.metal | c5d.metal | c5n.metal | c6a.metal | c6g.metal | c6gd.metal | c6i.metal | c6id.metal | c6in.metal | c7g.metal

    • Memory optimized: r5.metal | r5b.metal | r5d.metal | r5dn.metal | r5n.metal | r6a.metal | r6g.metal | r6gd.metal | r6i.metal | r6idn.metal | r6in.metal

    • Storage optimized: i3.metal | i3en.metal | i4i.metal

    • Accelerated computing: g4dn.metal | g5g.metal

    Learn more

    For more information, see the following videos:

    • AWS re:Invent 2017: The Amazon EC2 Nitro System Architecturearrow-up-right

    • AWS re:Invent 2017: Amazon EC2 Bare Metal Instancesarrow-up-right

    • AWS re:Invent 2019: Powering next-gen Amazon EC2: Deep dive into the Nitro systemarrow-up-right

    hashtag
    Networking and storage features

    When you select an instance type, this determines the networking and storage features that are available. To describe an instance type, use the describe-instance-typesarrow-up-right command.

    Networking features

    • IPv6 is supported on all current generation instance types and the C3, R3, and I2 previous generation instance types.

    • To maximize the networking and bandwidth performance of your instance type, you can do the following:

      • Launch supported instance types into a cluster placement group to optimize your instances for high performance computing (HPC) applications. Instances in a common cluster placement group can benefit from high-bandwidth, low-latency networking. For more information, see .

      • Enable enhanced networking for supported current generation instance types to get significantly higher packet per second (PPS) performance, lower network jitter, and lower latencies. For more information, see .

    • Current generation instance types that are enabled for enhanced networking have the following networking performance attributes:

      • Traffic within the same Region over private IPv4 or IPv6 can support 5 Gbps for single-flow traffic and up to 25 Gbps for multi-flow traffic (depending on the instance type).

      • Traffic to and from Amazon S3 buckets within the same Region over the public IP address space or through a VPC endpoint can use all available instance aggregate bandwidth.

    • The maximum transmission unit (MTU) supported varies across instance types. All Amazon EC2 instance types support standard Ethernet V2 1500 MTU frames. All current generation instances support 9001 MTU, or jumbo frames, and some previous generation instances support them as well. For more information, see .

    Storage features

    • Some instance types support EBS volumes and instance store volumes, while other instance types support only EBS volumes. Some instance types that support instance store volumes use solid state drives (SSD) to deliver very high random I/O performance. Some instance types support NVMe instance store volumes. Some instance types support NVMe EBS volumes. For more information, see Amazon EBS and NVMe on Linux instancesarrow-up-right and NVMe SSD volumesarrow-up-right.

    • To obtain additional, dedicated capacity for Amazon EBS I/O, you can launch some instance types as EBS–optimized instances. Some instance types are EBS–optimized by default. For more information, see Amazon EBS–optimized instancesarrow-up-right.

    hashtag
    Summary of networking and storage features

    The following table summarizes the networking and storage features supported by current generation instance types.

    Instances

    • General purposearrow-up-right

    • Compute optimizedarrow-up-right

    • Memory optimizedarrow-up-right

    General purpose

    Instance type
    EBS only
    NVME EBS
    Instance store
    Placement group
    Enhanced networking

    M4

    Yes

    No

    No

    Yes

    ENA

    M5

    Compute optimized

    Instance type
    EBS only
    NVME EBS
    Instance store
    Placement group
    Enhanced networking

    C4

    Yes

    No

    No

    Yes

    Not supported

    C5

    Memory optimized

    Instance type
    EBS only
    NVME EBS
    Instance store
    Placement group
    Enhanced networking

    CR1

    No

    No

    HDD

    Yes

    Not supported

    Hpc6id

    Storage optimized

    Instance type
    EBS only
    NVME EBS
    Instance store
    Placement group
    Enhanced networking

    D2

    No

    No

    HDD

    Yes

    Not supported

    D3

    Accelerated computing

    Instance type
    EBS only
    NVME EBS
    Instance store
    Placement group
    Enhanced networking

    DL1

    No

    Yes

    NVMe

    Yes

    ENA | EFA

    F1

    Previous generation instance types

    The following table summarizes the networking and storage features supported by previous generation instance types.

    Instance type
    EBS only
    NVME EBS
    Instance store
    Placement group
    Enhanced networking

    A1

    Yes

    Yes

    No

    Yes

    ENA

    C1

    hashtag
    Instance limits

    There is a limit on the total number of instances that you can launch in a Region, and there are additional limits on some instance types.

    For more information about the default limits, see How many instances can I run in Amazon EC2?arrow-up-right

    For more information about viewing your current limits or requesting an increase in your current limits, see Amazon EC2 service quotasarrow-up-right.

    Category
    Service
    Descri­ption

    Instances(Virtual machines)

    EC2

    Web-scale cloud computing is simplified using It.

    EC2 Spot

    Up to 90% off fault-tolerant workloads are run by using this.

    EC2 Autosc­aling

    To meet changing demand, automatically add or remove compute capacity.

    Lightsail

    hashtag
    2. Storage

    Service
    Description

    AWS S3

    S3 is a distributed database that is connected to every device in the network through the Internet. It uses a peer-to-peer model, meaning that data is not stored on a central server. Instead, data is stored directly between the user and the service that the user is trying to access. This provides a faster and more reliable service than a traditional database would because it does not have to be transferred when a change is made.

    AWS Backup

    AWS Backup automates the entire backup process from storage to delivery — removing the need to manually input and process backup data. It provides end-to-end encryption of your backup data to help keep your data secure. AWS Backup is a highly efficient and cost-effective way to protect your business data.

    Amazon EBS

    Amazon Elastic Block Store provides block-level storage volumes. These storage volumes are created and managed from the web service's dashboard and can be used to backup your application data and store your logs. By providing storage volumes for your applications, you can create a controlled, low-­cost way to backup your application data and store your application logs in the cloud. You can also use the Elastic Block Store as a way to automatically rotate your application data to prevent data loss in the case of a hard or software failure.

    Amazon EFS Storage

    EFS is a blob Storage. Amazon EC2 instances can store files in EFS. You can think of it as a hosting service that offers you cloud storage for free. You can store any type of file with this cloud storage, and it's very fast. You can get up to 2 TB storage for free. You can increase this storage limit by purchasing more space. EFS provides an option to encrypt your files.

    Amazon FSx

    FSx for Windows Server and Lustre (fully managed high-performance file systems built on Windows Server) offer native compatibility and characteristic sets for workloads. FSx for Windows Server (favourite storage built on Windows Server) and Lustre (favourite file system integrated with S3) are available as FSx for Windows Server.

    hashtag
    3. Database

    Database

    type

    Use cases

    Service

    Description

    Relational

    Ecommerce websites, Traditional sites etc.

    Aurora,

    Redshift,

    RDS

    RDS enables you to easily set up, control, and scale a relational database in the cloud.

    Key-value

    Ecommerce Websites, gaming websites etc.

    DynamoDB

    DynamoDB is a highly-scalable, real-time database that provides advanced features such as automatic ETL (Extract, Transform, Load) and real-time analytics. It is also a non-relational database, which means it does not store query results.DynamoDB is engineered with low latency and high availability in mind. It combines the scalability and performance of a database with the flexibility of a JavaScript application store.

    In-memory

    You can download a PDF version of Aws Cheat Sheet.Download PDF

    hashtag


    hashtag
    4. Developer Tools

    Service
    Description

    Cloud9

    Cloud9 is a cloud-based IDE that allows developers to write, run, and debug code.

    CodeAr­tifact

    CodeAr­tifact is a secure storage, publishing, and sharing of software code packages used in a development process organisation's software development. CodeAr­tifact makes it easy for small organisations to store, publish, and share software packages.

    CodeBuild

    CodeBuild is a code creation service that also produces code artefacts upon request.

    CodeGuru

    CodeGuru is a machine learning tool that recommends improved code quality and safe code by analysing the frequency of certain lines of code.

    Cloud Develo­pment Kit

    AWS CDK is an open source software development framework that defines cloud application resources using familiar programming languages.

    hashtag
    5. Network and Content Delivery

    Use Case
    Service
    Description

    Build a cloud network

    VPC

    VPC lets you provision a logically isolated section of the AWS Cloud where you can launch AWS resources in a virtual network that you define.

    Transit Gateway

    Transit Gateway simplifies network and peering relationships by connecting VPCs & on-pre­mises networks through a central hub.

    Privat­eLink

    Privat­eLink is a great way to securely connect your on-premises workloads with the cloud, while still maintaining full control over who can access your data and application. You can use PrivateLink to securely connect your on-premises data center to your AWS data lake, while providing the full tenant control and regulatory compliance of an on-premises data center.

    hashtag
    6. Security, Identity, & Compliance

    Category
    Service
    Description

    Identity & access management

    Identity & Access Management (IAM)

    IAM provides secure and controlled access to AWS services.

    Single Sign-On

    SSO simplifies, manages, and provides access to AWS accounts & business applications.

    Cognito

    Cognito helps in storing user sign-up data in the same database as your other web & mobile app data and manage user access controls such as read permissions, roles, and identity management

    hashtag
    7. Migration & Transfer services

    Service
    Description

    Migration Evaluator

    To start using AWS, you need to first build a case for why the service is useful to your organisation. An easy way to do that is to build a Migration Evaluator, which is a detailed analysis of your current infrastructure and recommendations for how to best move forward.

    Migration Hub

    The migration hub tracks each app's effort to migrate to a new solution, such as a new solution release or a new partner. The migration hub not only tracks the app’s progress toward its goal, but records each action taken to get the app to the new solution, such as uploading a new solution package.

    Migration Hub includes an easy-to-use dashboard for monitoring the progress of each app’s migrations. Once you’ve set up the dashboard, you can view the status of each migration and any action taken to get the app to the new solution. You can also view a list of all partners the app is connected to and view the progress of each partner’s migration.

    Applic­ation Discovery Service

    The service makes it easier for enterprises to collect data, analyse it, and create insight with real-time dashboarding that visualises data-driven decisions. By using AI and machine learning to predict user behaviour, businesses can save time and money by eliminating unplanned outages and rework caused by changes to app or IT servers.

    Server Migration Service (SMS)

    With SMS, you can move millions of pieces of business data across clouds, without needing to learn new technologies or hiring new staff. SMS works by relocating your apps from your on-premises data centre to the cloud, then tunnelling back between clouds as needed. SMS makes it easier to scale since there’s no need to add new hardware or change software.

    Database Migration Service (DMS)

    A DMS solution provides a set of tools that allows a data manager to: create an account, select aAWS region, create a service account, and create aAWS Identity & Access Management (IAM) role. Once a DMS solution is selected, the data manager can create an account and assign a role to the DMS solution. The data manager can then create a database, select aAWS region, and select aAWS Availability Zone (AZ). The data manager should select a unique name for the database, such as my_cool_app. This name is used throughout the AWS ecosystem and will be visible to other AWS users. The data manager can then create tables in the database and assign permissions to objects in the tables. The data manager can then enable the migration of data to the new database, by selecting the migration option. This allows other AWS users to view the new database and migrate data to the new database.

    hashtag
    8. Cost Management

    Use Cases
    Capabilities
    Description

    Organize

    Construct cost allocation & governance foundation with your own tagging strategy

    Cost Categories helps you to segment your AWS platform and process usage data to better understand costs and develop cost-effective infrastructure and operations.

    Report

    Provide users with information about their cloud costs by providing detailed allocable cost data

    You can use this report to get a quick and detailed view of the AWS ecosystem and its infrastructure. You can also use this report to get a deeper understanding of AWS services and their cost & usage. You can use this data to help you make informed decisions about which AWS services to use and which to ignore. You can also use the data to make customized reports. This data is publicly available and made freely available by the AWS Repo. The AWS Repo is the primary source of this data, and the data is updated frequently.

    Access

    In a unified view, track billing information is tracked across the organisation.

    The amount of credits an account pays to a service provider in order to cover its costs is known as its billing obligation.

    hashtag
    9. SKDs and Toolkits

    Service
    Description

    CDK

    It was designed to solve the common problem of building mobile apps with a low level of abstraction. This reduces the need to manually code up elaborate logic and keeps the focus on developing apps using high-level language features. Familiarity with the syntax of your favorite language increases the ease of use of your app, as well as its chances of adoption by users. The more familiar your audience with your app, the more likely they are to install it.

    Corretto

    It is a free and open source software distribution, which can be used for both desktop and mobile apps. The goal of the project is to make it as com­pact and lightweight as pos­si­ble, while at the same time stri­king a balance between speed and power. The project is led by SBase, an open source Java project, and collaborates with the other major OpenJDK project members

    Crypto Tools

    The AWS Crypto Tools libraries help you do your research andSolidity, Serpent, or Vyper are examples of popular JavaScript crypto­graphics libraries. The AWS Crypto Tools libraries are based on the open source Shepherds project. Shepherds is a widely-used and well-regarded implementation of the Diffie-Helman key-exchange algorithm in the Go programming language.

    Serverless Applic­ation Model (SAM)

    You can use SAM to create serverless apps that work with data from within your current application code. You can also use SAM to write serverless code that can be used in other applications. It can be used to create serverless applications that work with data from within your current application code. It can also be used to create serverless code that can be used in other applications.

    hashtag
    10. Data Lakes & Analytics

    Category
    Service
    Description

    Analytics

    Athena

    Athena is a free service with no ads or hidden charges. You can use this service to analyze your data in real-time or query past data with a predefined set of rules. You can also run reports and drill-downs that let you explore data in more detail. When using Athena, don’t limit yourself to looking at the numbers. Think about what you’re analyzing and find a way to make sense of the data.

    EMR

    EMR is a data management engine that helps enterprises collect and analyze data from their data warehouses and other sources. It provides a common platform for data collection and analysis, and can be used to create real-time and historical reports. The term EMR is also used to refer to any software or platform that provides a similar set of benefits.

    Redshift

    It helps you store, process, and analyze your data with a data warehouse. It stores data in a relational database, and provides a set of tools for manipulating data and creating reports.

    hashtag
    11. Containers

    Use Cases
    Service
    Description

    Store, encrypt, and manage container images

    ECR

    Refer to the compute section. It has already been explained there.

    Run contai­nerized applic­ations or build micros­ervices

    ECS

    Refer to the compute section. It has already been explained there.

    Manage containers with Kubernetes

    EKS

    Refer to the compute section. It has already been explained there.

    hashtag
    12. Serverless

    Category
    Service
    Description

    Compute

    Lambda

    Lambda is a cloud-based service that functions as a sort of middleman. Data flows through the middleman and is processed at a data centre of your choice. The code running on the server is only responsible for processing request data, not generating it. This code is called the “backend” and is what most people think of when they think of “serverless.” It’s not a “server” at all. The code running on the serverless platform is purely “blackbox” in that it does not know what data it receives and it does not manage or store any of the data it receives or emit any data of its own. The backend code receives requests from clients and processes them accordingly.

    Lambda­@Edge

    Amazon CloudFront provides Lambda­@Edge, which allows you to run code closer to users of your application, which improves performance and reduces latency.

    Fargate

    Refer to the containers section. It has already been explained there.

    hashtag
    13. Application Integration

    Category
    Service
    Integration

    Messaging

    SNS

    Reliable high- throughput pub/sub, SMS, email, and mobile push notifications

    SQS

    App­li­ca­tion com­pan­ies may use a message queue that send, store, and receive messages between appli­ca­tion parts at any volume to send, store, and retrieve messages between appli­ca­tion parts.

    MQ

    The broker that allows for easy and hybrid architectures in Apache ActiveMQ is what makes migrating easy and hybrid architectures possible.

    hashtag
    14. Management and Governance

    Category
    Service
    Description

    Enable

    Control Tower

    The simplest method to set up and govern a new, secure Multi-­account AWS environment

    Organi­zations

    As your AWS workloads grow and scale, organizations can assist in centrally governing the environment by helping to centralise governing operations.

    Well-A­rch­itected Tool

    Well-architected means that the resources and data are properly separated and accessed sequentially, with low latency between requests. You can use the well-architected tool to help determine if your workloads are well-architected and to monitor their performance and scalability. When you have well-architected apps, you can focus on building great experiences, not infrastructure.

    EC2

    hashtag
    EC2

    • EC2 stands for Amazon Elastic Compute Cloud.

    • Amazon EC2 is a web service that provides resizable compute capacity in the cloud.

    • Amazon EC2 reduces the time required to obtain and boot new user instances to minutes rather than in older days, if you need a server then you had to put a purchase order, and cabling is done to get a new server which is a very time-consuming process. Now, Amazon has provided an EC2 which is a virtual machine in the cloud that completely changes the industry.

    • You can scale the compute capacity up and down as per the computing requirement changes.

    • Amazon EC2 changes the economics of computing by allowing you to pay only for the resources that you actually use. Rather than you previously buy physical servers, you would look for a server that has more CPU capacity, RAM capacity and you buy a server over 5 year term, so you have to plan for 5 years in advance. People spend a lot of capital in such investments. EC2 allows you to pay for the capacity that you actually use.

    • Amazon EC2 provides the developers with the tools to build resilient applications that isolate themselves from some common scenarios.

    hashtag
    EC2 Pricing Options

    hashtag
    On Demand

    • It allows you to pay a fixed rate by the hour or even by the second with no commitment.

    • Linux instance is by the second and windows instance is by the hour.

    • On Demand is perfect for the users who want low cost and flexibility of Amazon EC2 without any up-front investment or long-term commitment.


    hashtag
    Reserved

    • It is a way of making a reservation with Amazon or we can say that we make a contract with Amazon. The contract can be for 1 or 3 years in length.

    • In a Reserved instance, you are making a contract means you are paying some upfront, so it gives you a significant discount on the hourly charge for an instance.

    • It is useful for applications with steady state or predictable usage.

    Types of Reserved Instances:

    • Standard Reserved Instances

    • Convertible Reserved Instances

    • Scheduled Reserved Instances

    Standard Reserved Instances

    • It provides a discount of up to 75% off on demand. For example, you are paying all up-fronts for 3 year contract.

    • It is useful when your Application is at the steady-state.

    Convertible Reserved Instances

    • It provides a discount of up to 54% off on demand.

    • It provides the feature that has the capability to change the attributes of RI as long as the exchange results in the creation of Reserved Instances of equal or greater value.

    • Like Standard Reserved Instances, it is also useful for the steady state applications.

    Scheduled Reserved Instances

    • Scheduled Reserved Instances are available to launch within the specified time window you reserve.

    • It allows you to match your capacity reservation to a predictable recurring schedule that only requires a fraction of a day, a week, or a month.


    hashtag
    Spot Instances

    • It allows you to bid for a price whatever price that you want for instance capacity, and providing better savings if your applications have flexible start and end times.

    • Spot Instances are useful for those applications that have flexible start and end times.

    • It is useful for those applications that are feasible at very low compute prices.


    hashtag
    Dedicated Hosts

    • A dedicated host is a physical server with EC2 instance capacity which is fully dedicated to your use.

    • The physical EC2 server is the dedicated host that can help you to reduce costs by allowing you to use your existing server-bound software licenses. For example, Vmware, Oracle, SQL Server depending on the licenses that you can bring over to AWS and then they can use the Dedicated host.

    • Dedicated hosts are used to address compliance requirements and reduces host by allowing to use your existing server-bound server licenses.

    AWS S3 Lifecycle Management

    tLifecycle Management is used so that objects are stored cost-effectively throughout their lifecycle. A lifecycle configuration is a set of rules that define the actions applied by S3 to a group of objects.

    The lifecycle defines two types of actions:

    • Transition actions: When you define the transition to another storage class. For example, you choose to transit the objects to the Standard IA storage class 30 days after you have created them or archive the objects to the Glacier storage class 60 days after you have created them.

    • Expiration actions: You need to define when objects expire, the Amazon S3 deletes the expired object on your behalf.

    Suppose a business generates a lot of data in the form of test files, images, audio, or videos and the data is relevant for 30 days only. After that, you might want to transition from standard to standard IA as storage cost is lower. After 60 days, you might want to transit to Glacier storage class for the longtime archival. Perhaps you want to expire the object after 60 days completely, so Amazon has a service known as Lifecycle Management, and this service exist within the S3 bucket.

    Lifecycle policies:

    • Use Lifecycle rules to manage your object: You can manage the Lifecycle of an object by using a Lifecycle rule that defines how Amazon S3 manages objects during their lifetime.

    • Automate transition to tiered storage: Lifecycle allows you to transition objects to the Standard IA storage class automatically and then to the Glacier storage class.

    • Expire your objects: Using the Lifecycle rule, you can automatically expire your objects.

    Creation of Lifecycle rule

    • Sign in to the AWS Management console.

    • Click on the S3 service

    • Create a new bucket in S3.

    • Now, you can configure the options, i.e., you can set the versioning, server access logging, etc. I leave all the settings as default and then click on the Next button.

    • Set the permissions. I leave all the permissions as default and then click on the Next button.

    • Click on the Create bucket button.

    • Finally, a new bucket is created whose name is “XYZ”.

    • Click on the XYZ bucket.

    From the above screen, we observe that the bucket is empty. Before uploading the objects in a bucket, we first create the policy.

    • Move to the Management tab; we use the lifecycle.

    • Add the Lifecycle rule and then enter the rule name. Click on the Next.

    • You can create the storage class transition in both the current version and the previous version. Initially, I create the transition in the current version. Check the current version and then click on the Add transition.

    First transition: 30 days after the creation of an object, the object’s storage class is converted to the Standard Infrequently access storage class.

    Second transition: 60 days after the creation of an object, the object’s storage class is converted to Glacier storage class.

    • Similarly, we can do with the previous version objects. Check the “previous version” and then “Add transitions”. Click on the Next.

    • Now, we expire the object after its creation. Suppose we expire the current and previous version objects after 425 days of their creation. Click on the Next.

    • The Lifecycle rule is shown given below:

    • Click on the Save.

    The above screen shows that “Lifecyclerule” has been created.

    hashtag
    Important points to be remembered:

    • It can be used either in conjunction with the versioning or without versioning.

    • Lifecycle Management can be applied to both current and previous versions.

    • The following actions can be done:

    AWS VPC

    hashtag
    What is VPC

    • VPC stands for Virtual Private Cloud.

    • Amazon Virtual Private Cloud (Amazon VPC) provides a logically isolated area of the AWS cloud where you can launch AWS resources in a virtual network that you define.

    • You have complete control over your virtual networking environment, including a selection of your IP address range, the creation of subnets, and configuration of route tables and network gateways.

    • You can easily customize the network configuration for your Amazon Virtual Private Cloud. For example, you can create a public-facing subnet for web servers that can access to the internet and can also place your backend system such as databases or application servers to a private-facing subnet.

    • You can provide multiple layers of security, including security groups and network access control lists, to help control access to Amazon EC2 instances in each subnet.

    hashtag
    Architecture of VPC

    The outer line represents the region, and the region is us-east-1. Inside the region, we have VPC, and outside the VPC, we have internet gateway and virtual private gateway. Internet Gateway and Virtual Private Gateway are the ways of connecting to the VPC. Both these connections go to the router in a VPC and then router directs the traffic to the route table. Route table will then direct the traffic to Network ACL. Network ACL is the firewall or much like security groups. Network ACL are statelist which allows as well as deny the roles. You can also block the IP address on your Network ACL. Now, move over to the security group that accesses another line against the EC2 instance. It has two subnets, i.e., Public and Private subnet. In public subnet, the internet is accessible by an EC2 instance, but in private subnet, an EC2 instance cannot access the internet on their own. We can connect the instances. To connect an instance, move over to the public subnet and then it SSH to the private subnet. This is known as jump boxes. In this way, we can connect an instance in public subnet to an instance in private subnet.

    Some ranges are reserved for private subnet:

    • 10.0.0.0 - 10.255.255.255 (10/8 prefix)

    • 172.16.0.0 - 172.31.255.255 (172.16/12 prefix)

    • 192.168.0.0 - 192.168.255.255 (192.108/16 prefix)

    AD

    hashtag
    What can we do with a VPC?

    • Launch instances in a subnet of your choosing. We can choose our own subnet addressing.

    • We can assign custom IP address ranges in each subnet.

    • We can configure route tables between subnets.

    hashtag
    VPC Peering

    • VPC Peering is a networking connection that allows you to connect one VPC with another VPC through a direct network route using private IP addresses.

    • Instances behave as if they were on the same private network.

    • You can peer VPC's with other AWS accounts as well as other VPCs in the same account.

    Note: Non-Transitive Peering means the networks that you want to connect are directly linked.

    • You can peer between regions. Suppose you have one VPC in one region and other VPC in another region, then you can peer the VPCs between different regions.

    Let's understand the example of non-transitive peering through an example.

    The above figure shows that VPC B has peered to the VPC A, so instance in VPC B can talk to VPC A. However, VPC B cannot talk to VPC C through VPC A. This is known as Non-Transitive Peering, i.e., both VPC C and VPC B are not directly linked so they cannot talk to each other.

    So, to communicate between VPC B and VPC C, we need to peer them as shown in the below figure.

    hashtag
    Amazon VPC and Subnets

    Amazon VPC enables you to connect your on-premises resources to AWS infrastructure through a virtual private network. This virtual network closely resembles a traditional network that you'd operate in your data center but enables you to leverage the scalable infrastructure in AWS.

    Each VPC that you create is logically isolated from other virtual networks in the AWS cloud and is fully customizable. You can select the range, create subnets, configure root tables, set up network gateways, define security settings using security groups, and network access control

    hashtag
    Default Amazon VPC

    Each Amazon account comes with a default VPC that is pre-configured for you to start using immediately. A VPC can span multiple availability zones in a region. This is the diagram of a default VPC:

    In the first section, there is a default Amazon VPC. The CIDR block for the default VPC is always a 16 subnet mask; in this example, it's 172.31.0.0/16. It means this VPC can provide up to 65,536 IP addresses.

    hashtag
    Custom Amazon VPC

    The default VPC is suitable for launching new instances when you're testing AWS, but creating a custom VPC allows you to:

    • Make things more secure

    • Customize your virtual network, as you can define your own our IP address range

    • Create your subnets that are both private and public

    hashtag
    Hardware VPN Access

    By default, instances that you launch into an Amazon VPC can't communicate with your network. You can connect your VPCs to your existing data center using hardware VPN access. By doing so, you can effectively extend your data center into the cloud and create a hybrid environment. To do this, you will need to set up a virtual private gateway.

    There is a VPN concentrator on the Amazon side of the VPN connection. For your data center, you need a customer gateway, which is either a physical device or a software application that sits on the customer’s side of the VPN connection. When you create a VPN connection, a VPN tunnel comes up when traffic is generated from the customer's side of the connection.

    hashtag
    VPC Peering

    A peering connection can be made between your own VPCs or with a VPC in another AWS account, as long as it is in the same region.

    If you have instances in VPC A, they wouldn't be able to communicate with instances in VPC B or C unless you set up a peering connection. Peering is a one-to-one relationship; a VPC can have multiple peering connections to other VPCs, but transitive peering is not supported. In other words, VPC A can connect to B and C in the above diagram, but C cannot communicate with B unless directly paired.

    Additionally, VPCs with overlapping CIDRs cannot be paired. In the diagram, all VPCs have different IP ranges. If they have the same IP ranges, they wouldn't be able to pair.

    Default VPC Deletion

    In the event that the default VPC gets deleted, it is advised to reach out to AWS support for restoration. Therefore, you’ll only want to delete the default VPC only if you have a good reason.

    After going through what AWS VPC is, let us next learn the IP addresses.

    hashtag
    Private, Public, and Elastic IP Addresses

    hashtag
    Private IP addresses

    IP addresses not reachable over the internet are defined as private. Private IPs enable communication between instances in the same network. When you launch a new instance, a private IP address is assigned, and an internal DNS hostname allocated to resolves to the private IP address of the instance. If you want to connect to this from the internet, it will not work. You would need a public IP address for that.

    hashtag
    Public IP addresses

    Public IP addresses are used for communication between other instances on the internet and yours. Each instance with a public IP address is assigned an external DNS hostname too. Public IP addresses linked to your instances are from Amazon's list of public IPs. On stopping or terminating your instance, the public IP address gets released, and a new one is linked to the instance when it restarts. For retention of this public IP address even after stoppage or termination, an elastic IP address needs to be used.

    hashtag
    Elastic IP Addresses

    Elastic IP addresses are static or persistent public IPs that come with your account. If any of your software or instances fail, they can be remapped to another instance quickly with the elastic IP address. An elastic IP address remains in your account until you choose to release it. A charge is associated with an Elastic IP address if it is in your account, but not allocated to an instance.

    As a part of our AWS VPC tutorial, let us learn about subnets.

    hashtag
    Subnet

    AWS defines a subnet as a range of IP addresses in your VPC. You can launch AWS resources into a selected subnet. A public subnet can be used for resources connected to the internet and a private subnet for resources not connected to the internet.

    The netmask for a default subnet in your VPC is always 20, which provides up to 4,096 addresses per subnet, with few of them reserved for AWS use. The VPC can span multiple availability zones, but the subnet is always mapped to a single availability zone.

    The following is a basic diagram of a subnet:

    There is a virtual private cloud consisting of availability zones. A subnet is created inside each availability zone, and you cannot launch any instances unless there are subnets in your VPC.

    hashtag
    Public and Private Subnets

    There are two types of subnets: public and private. A public subnet is used for resources that must be connected to the internet; web servers are an example. A public subnet is made public because the main route table sends the subnets traffic that is destined for the internet to the internet gateway.

    Private subnets are for resources that don't need an internet connection, or that you want to protect from the internet; database instances are an example.

    Let us extend our AWS VPC tutorial by looking into networking.

    hashtag
    Networking

    hashtag
    Internet Gateway

    An internet gateway is a redundant, horizontally scaled, and is a highly available VPC component. It enables communication between instances in your VPC and the internet. Therefore, it imposes no availability risks or bandwidth constraints on your network traffic.

    To give your VPC the ability to connect to the internet, you need to attach an internet gateway. Only one internet gateway can be attached per VPC. Attaching an internet gateway is the first stage in permitting internet access to instances in your VPC.

    In this diagram, we've added the internet gateway that is providing the connection to the internet to your VPC. For an instance to be internet-connected, you have to adhere to the following rules:

    1. Attach an Internet gateway to your VPC

    2. Ensure that your instances have either a public IP address or an elastic IP address

    3. Point your subnet’s route table to the internet gateway

    hashtag
    Route Table

    Amazon defines a route table as a set of rules, called routes, which are used to determine where network traffic is directed.

    Each subnet has to be linked to a route table, and a subnet can only be linked to one route table. On the other hand, one route table can have associations with multiple subnets. Every VPC has a default route table, and it is a good practice to leave it in its original state and create a new route table to customize the network traffic routes associated with your VPC. The route table diagram is as shown:

    In this example, we've added two route tables: the main route table and the custom route table. The new route table or the custom route table informs the internet gateway to direct

    internet traffic to the public subnet. However, the private subnet is still associated with the default route table, the main route table that does not allow internet traffic. All traffic inside the private subnet remains local.

    hashtag
    NAT Devices

    A Network Address Translation (NAT) device can be used to enable instances in a private subnet to connect to the internet or the AWS services, but this prevents the internet from initiating connections with the instances in a private subnet.

    As mentioned earlier, public and private subnets protect your assets from being directly connected to the internet. For example, your web server would sit in the public subnet and database in the private subnet, which has no internet connectivity. However, your private subnet database instance might still need internet access or the ability to connect to other AWS resources. You can use a NAT device to do so.

    The NAT device directs traffic from your private subnet to either the internet or other AWS services. It then sends the response back to your instances. When traffic is directed to the internet, the source IP address of your instance is replaced with the NAT device address, and when the internet traffic returns, the NAT device translates the address to your instance’s private IP address.

    NAT device diagram:

    In the diagram, you can see a NAT device is added to the public subnet to get internet connectivity.

    hashtag
    NAT Gateway vs. NAT Device

    AWS provides two kinds of NAT devices:

    • NAT gateway

    • NAT instance

    AWS recommends the NAT gateway because it is a managed service that provides better bandwidth and availability compared to NAT instances. Every NAT gateway is created in a specific availability zone and with redundancy in that zone. A NAT Amazon Machine Image (AMI) is used to launch a NAT instance, and it subsequently runs as an instance in your VPC.

    hashtag
    NAT Gateway

    A NAT gateway must be launched in a public subnet because it needs internet connectivity. It also requires an elastic IP address, which you can select at the time of launch.

    Once created, you need to update the route table associated with your private subnet to point internet-bound traffic to the NAT gateway. This way, the instances in your private subnet can communicate with the internet.

    As a part of our learning about the AWS VPS, security groups and network ACLs takes an important role. So, let's dive in.

    hashtag
    Security Groups and Network ACLs

    Amazon defines a security group as a virtual that controls the traffic for one or more instances. Rules are added to each security group, which allows traffic to or from its associated instances. Basically, a security group controls inbound and outbound traffic for one or more EC2 instances. It can be found on both the EC2 and VPC dashboards in the AWS web management console.

    Security group diagram:

    hashtag
    Security Groups for Web Servers

    A web server needs HTTP and HTTPS traffic at the least to access it. The following is an example of the security group table:

    Here, we allow HTTP and HTTPS, the ports associated with them, and the sources from the internet. All traffic is allowed to those ports, so any other traffic that arrives on different ports would be unable to reach the security group and the instances inside.

    hashtag
    Security Groups for Database Servers

    If we consider a server database, then you need to open the SQL server port to access it.

    We've allowed the source to come from the internet. Because it's a Windows machine, you may need RDP access to log on and do some administration. We've also added RDP access to the security group. You could leave it open to the internet, but that would mean anyone could try and hack their way into your box. In this example, we've added a source IP address of 10.0.0.0, so the only IP ranges from that address can RDP to the instance.

    hashtag
    Security Groups Rules

    There are a few rules associated with security groups, such as:

    • Security groups allow all outbound traffic by default. If you want to tighten your security, this can be done in a similar way as you define the inbound traffic

    • Security group rules are always permissive. You can't create rules that deny access

    • Security groups are stateful. If a request is sent from your instance, the response traffic for that request is allowed to flow in, regardless of the inbound security group rules

    hashtag
    Network ACL

    The Network Access Control List (ACL) is an optional security layer for your VPC. It acts as a firewall for controlling traffic flow o and from one or more subnets. Network ACLs can be set up with rules similar to your security groups

    Here is the network diagram:

    You can find the Network ACLs located somewhere between the root tables and the subnets. Here is a simplified diagram:

    You can see an example of the default network ACL, which is configured to allow all traffic to flow in and out of the subnet to which it is associated.

    Each network ACL includes a rule an * (asterisk) as the rule number. The rule makes sure that if a packet is identified as not matching any of the other numbered rules, traffic is denied. You can't modify or remove this rule.

    For traffic coming on the inbound:

    • Rule 100 would allow traffic from all sources

    • Rule * would deny traffic from all sources

    hashtag
    Network ACL Rules

    • Every subnet in your VPC must be associated with an ACL, failing which the subnet gets automatically associated with your default ACL.

    • One subnet can only be linked with one ACL. On the other hand, an ACL can be linked to multiple subnets.

    • An ACL has a list of numbered rules that are evaluated in order, starting with the lowest. As soon as a rule matches, traffic is supplied regardless of any higher-numbered rules that may contradict it. AWS recommends incrementing your rules by a factor of 100. This allows for plenty of room to implement new rules at a later date.

    Let us next look into the AWS VPC best practices.

    hashtag
    Amazon VPC Best Practices and Costs

    hashtag
    Public and private subnets

    You should use private subnets to secure resources that don't need to be available to the internet, such as database services. It enables the flexibility to launch a service in the subnets.

    hashtag
    Provide NAT to private subnets

    To provide secure internet access to instances that reside in your private subnets, you should leverage a NAT device.

    hashtag
    Use NAT gateways

    When using NAT devices, you should use the NAT gateway over NAT instances because they are managed services and require less administration. It also provides secure internet access to your private subnets.

    hashtag
    CIDR blocks

    You should choose CIDR blocks carefully; Amazon VPC can contain anywhere from 16 to 65,536 IP addresses. You can select your CIDR block according to the number of instances needed.

    hashtag
    Create different VPCs for different environments

    You should also create a separate Amazon VPC for development, staging, and test and production environments. Another option is to create an Amazon VPC with separate subnets with a subnet for each production, development, staging, and tests.

    hashtag
    Understand Amazon VPC limits

    There are various limitations to the VPC components. For example, you're allowed:

    • Five VPCs per region

    • 200 subnets per VPC

    • 200 route tables per VPC

    However, some of these limits can be increased by submitting a ticket to AWS support.

    hashtag
    Use security groups and network ACLs

    You should use security groups and network ACLs to secure the traffic coming in and out of your VPC. Amazon advises using security groups for whitelisting traffic and network ACLs for blacklisting traffic.

    hashtag
    Tier security groups

    Amazon recommends tiering your security groups. You should create different security groups for different tiers of your infrastructure architecture inside VPC. If you have web server tiers and database tiers, you should create different security groups for each of them. Creating tier wise security groups increases the infrastructure security inside the Amazon VPC. So, if you launch all your web servers in the web server security group, that means they'll automatically have HTTP and HTTPS open. Conversely, the database security group will have SQL server ports already open.

    hashtag
    Standardize security group naming conventions

    Following a security group, the naming convention allows Amazon VPC operation and management for large scale deployments to become much easier.

    hashtag
    Span Amazon VPC

    Make sure to span your Amazon VPC across multiple subnets across multiple availability zones within a region. This helps in architecting high availability inside your VPC.

    hashtag
    Amazon VPC costs

    If you opt to create a hardware VPN connection associated with your VPC using Virtual Private Gateway, you will have to pay for each VPN connection hour that your VPN connection is provisioned and available. Each partial VPN connection hour consumed is billed as a full hour. You'll also incur standard AWS data transfer charges for all data transferred via the VPN connection.

    If you create a NAT gateway in your VPC, Charges are levied for each NAT gateway hour that your NAT gateway is provisioned and available for. Data processing charges apply for each gigabyte processed through a NAT gateway. Each partial NAT gateway hour consumed is billed as a full hour.

    AMI

    hashtag
    AMI

    • An AMI stands for Amazon Machine Images.

    • An AMI is a virtual image used to create a virtual machine within an EC2 instance.

    • You can also create multiple instances using single AMI when you need instances with the same configuration.

    • You can also create multiple instances using different AMI when you need instances with a different configuration.

    • It also provides a template for the root volume of an instance.

    hashtag
    AMI Lifecycle

    • First, you need to create and register an AMI.

    • You can use an AMI to launch EC2 instances.

    • You can also copy an AMI to some different region.

    hashtag
    AMI Types

    AMI is divided into two categories:

    • EBS - backed Instances

    • Instance Store - backed Instances

    hashtag
    EBS - backed Instances

    • EBS is nothing but a volume that provides you persistent storage.

    • When you run an EC2 instance that provides you temporary storage, if you delete an EC2 instance then the data stored in the EC2 instance will also be deleted. To make a data persistent, Amazon provides an EBS Volume. If you launch an EC2 instance and want to make some data persistent, then you need to attach an instance with the EBS Volume so that your data would be available even on deleting an EC2 instance.

    • When you launch an EC2 instance, it will always have a root device as an EBS Volume which makes the data persistent. Therefore, we can say that when we delete an EC2 instance, then the data is available in a root device.

    hashtag
    Instance Store - backed Instances

    • In Instance-Store, an instance consists of storage approx 1 TB or 2 TB which is temporary storage. As soon as the instance is terminated, all the data will be lost. For example, if you launch an instance, and deploy the database in it. If you delete an instance, then all the data will be lost and this becomes the challenge. In such a scenario, you can add an additional EBS Volume that also stores the data, so even if you delete an instance, your data would not be lost.

    • In this case, EBS Volume is not a root volume. It's an additional volume that you attach to your EC2 instance manually.

    hashtag
    Why EBS - backed instance is more popular than Instance Store - backed instance?

    hashtag
    Instance Store - backed instances

    In Instance Store - backed instance, if you launch an instance, it would be in a pending state. After pending state, an instance comes in a running state then it would be in a shutting down state. Amazon would charge you only when it is in a running state. When you terminate an instance, Amazon would not charge you any cost. For example, if you want to run an instance for 4 hours a day and it would cost you 10 cents per hour. In instance store, my instance would be running 24 hrs a day as it has no stopped state. Therefore, it would cost 72 dollars a month.

    • EBS - backed Instances

    In EBS - backed instances, an instance can be either in a running state or in a stopped state. In this case, Amazon would cost you only for a running state, not for a stopped state. For example, if you want to run an instance for 4 hours a day and it would cost you 10 cents per hour. In EBS - backed instance, an instance will run for 4 hours as it has stopped state as well. I take a 100 GB volume that would cost you 5 dollars. The running cost of an instance would be 12 dollars in a month. Therefore, the total cost taken by this instance is volume cost plus running cost which is equal to 17 dollars.

    EBS-backed instance is saving our 55 dollars. Therefore, we conclude that why EBS-backed instance is more popular and faster than instance store-backed instance.

    hashtag
    Difference b/w Instance store & EBS - backed instance

    Characteristics
    EBS-backed instance
    Instance Store-backed instance

    EBS

    hashtag
    What is EBS?

    • EBS stands for Elastic Block Store.

    • EC2 is a virtual server in a cloud while EBS is a virtual disk in a cloud.

    • Amazon EBS allows you to create storage volumes and attach them to the EC2 instances.

    • Once the storage volume is created, you can create a file system on the top of these volumes, and then you can run a database, store the files, applications or you can even use them as a block device in some other way.

    • Amazon EBS volumes are placed in a specific availability zone, and they are automatically replicated to protect you from the failure of a single component.

    • EBS volume does not exist on one disk, it spreads across the Availability Zone. EBS volume is a disk which is attached to an EC2 instance.

    • EBS volume attached to the EC2 instance where windows or Linux is installed known as Root device of volume.

    hashtag
    EBS Volume Types

    Amazon EBS provides two types of volume that differ in performance characteristics and price. EBS Volume types fall into two parts:

    • SSD-backed volumes

    • HDD-backed volumes

    hashtag
    SSD

    • SSD stands for solid-state Drives.

    • In June 2014, SSD storage was introduced.

    • It is a general purpose storage.

    SSD is further classified into two parts:

    • General Purpose SSD

    • Provisioned IOPS SSD

    General Purpose SSD

    • General Purpose SSD is also sometimes referred to as a GP2.

    • It is a General purpose SSD volume that balances both price and performance.

    • You can get a ratio of 3 IOPS per GB with up to 10,000 IOPS and the ability to burst up to 3000 IOPS for an extended period of time for volumes at 3334 GiB and above. For example, if you get less than 10,000 IOPS, then GP2 is preferable as it gives you the best performance and price.

    Provisioned IOPS SSD

    • It is also referred to as IO1.

    • It is mainly used for high-performance applications such as intense applications, relational databases.

    • It is designed for I/O intensive applications such as large relational or NOSQL databases.


    hashtag
    HDD

    • It stands for Hard Disk Drive.

    • HDD based storage was introduced in 2008.

    • The size of the HDD based storage could be between 1 GB to 1TB.

    hashtag
    Throughput Optimized HDD (st1)

    • It is also referred to as ST1.

    • Throughput Optimized HDD is a low-cost HDD designed for those applications that require higher throughput up to 500 MB/s.

    • It is useful for those applications that require the data to be frequently accessed.

    hashtag
    Cold HDD (sc1)

    • It is also known as SC1.

    • It is the lowest cost storage designed for the applications where the workloads are infrequently accessed.

    • It is useful when data is rarely accessed.

    hashtag
    Magnetic Volume

    • It is the lowest cost storage per gigabyte of all EBS volume types.

    • It is ideal for the applications where the data is accessed infrequently

    • It is useful for applications where the lowest storage cost is important.

    AWS Route53

    hashtag
    What is DNS?

    • DNS stands for Domain Name System.

    • DNS is used when you use an internet. DNS is used to convert human-friendly domain names into an Internet Protocol (IP) address.

    • IP addresses are used by computers to identify each other on the network.

    • IP addresses are of two types, i.e., Ipv4 and Ipv6.

    hashtag
    Top Level Domains

    • Domains are seperated by a string of characters seperated by dots. For example, google.com, gmail.com, etc.

    • The last word in a domain name is known as a Top Level Domain.

    • The second word in a domain name is known as a second level domain name.

    hashtag
    For example:

    .com: .com is a top-level domain.

    .edu: .edu is a top-level domain.

    .gov: .gov is a top-level domain.

    .co.uk: .uk is a top-level domain name while .co is a second level domain name.

    .gov.uk: .uk is a top-level domain name while .gov is a second level domain name.

    • The Top level domain names are controlled by IANA (Internet Assigned Numbers Authority).

    • IANA is a root zone database of all available top-level domains.

    • You can view the database by visiting the site: http://www.iana.org/domains/root/db

    hashtag
    Domain Registrars

    • Domain Registrar is an authority that assigns the domain names directly under one or more top-level domains.

    • Domain Registrar is used because all the names in a domain name must be unique there needs to be a way to organize these domain names so that they do not get duplicated.

    • Domain names are registered with interNIC, a service of ICANN, which enforces uniqueness of domain name across the internet.

    hashtag
    State Of Authority Record (SOA)

    • SOA stores the information in Domain Name System (zone) about the zone and other DNS records. Where DNS zone is a space allocated for a particular type of server.

    • Each DNS zone consists of a single SOA record.

    hashtag
    The State of Authority Record stores the information about:

    • The name of the server that supplies the data for the zone.

    • The administrator of the zone, i.e., who is administering the zone.

    • The current version of the data file that contains the zone.

    hashtag
    NS Records

    • NS stands for Name Server records.

    • NS Records are used by Top Level Domain Servers to direct traffic to the Content DNS server which contains the authoritative DNS records.

    hashtag
    Let's understand through a simple example.

    Suppose the user wants an IP address of hindi100.com. If ISP does not know the IP address of hindi100.com, ISP goes to the .com and asks for the NS Record. It finds that time-to-live is 172800 and its ns record is ns.awsdns.com. ISP moves to this ns record and asks that "do you know hindi100.com". Yes, it knows, so it points to Route53. In SOA, we have all the DNS types and 'A' records.

    hashtag
    A Records

    • An 'A' record is a fundamental type of DNS record.

    • 'A' stands for Address.

    • An 'A' record is used by the computer to convert the domain name into an IP address. For example, https://www.javatpoint.com might point to http://123.10.10.80.

    hashtag
    TTL

    • The length that a DNS record is cached on either the Resolving power or the users owns local PC is equal to the value of the TTL in seconds.

    • The lower the time-to-live, the faster changes to DNS records take to propagate throughout the internet.

    hashtag
    CNAMES

    • A CNAME can be used to resolve one domain name to another. For example, you may have a mobile website with a domain name http://m.devices.com which is used when users browse to your domain name on their mobile devices. You may also want the name http://mobile.devices.com to resolve the same address.

    hashtag
    Alias Records

    • Alias Records are used to map resource record sets in your hosted zone to Elastic load balancers, CloudFront distributions, or S3 buckets that are configured as websites.

    • Alias records work like a CNAME record in that you can map one DNS name (http://www.example.com) to another target DNS name (elb1234.elb.amazonaws.com).

    • The key difference between a CNAME and Alias Record is that a CNAME cannot be used for naked domain names (zone apex) record, i.e., it cannot be used when something is written infront of the domain name. For example, http://www.example.com

    hashtag
    What Is Amazon Route 53?

    Route 53 is a web service that is a highly available and scalable Domain Name System (DNS.)

    Let’s understand what is Amazon Route 53 in technical terms. AWS Route 53 lets developers and organizations route end users to their web applications in a very reliable and cost-effective manner. It is a Domain Name System (DNS) that translates domain names into IP addresses to direct traffic to your website. In simple terms, it converts World Wide Web addresses like www.example.com to IP addresses like 10.20.30.40.

    Basically, domain queries are automatically routed to the nearest DNS server to provide the quickest response possible. If you use a web hosting company like GoDaddy, it takes 30 minutes to 24 hours to remap a domain to a different IP, but by using Route 53 in AWS it takes only a few minutes.

    Interested in learning AWS from experts? Check out Course now!

    hashtag
    How Amazon Route 53 works?

    AWS Route 53 connects requests to the infrastructure running in AWS. These requests include , Amazon EC2 instances, or Amazon S3 buckets. In addition to this, AWS Route 53 is also used to route users to infrastructure outside of AWS.

    AWS Route 53 can be easily used to configure DNS health checks, continuously monitor your applications’ ability to recover from failures, and control application recovery with Route 53 Application Recovery Controller. Further, AWS Route 53 traffic flow helps to manage traffic globally via a wide variety of routing types including latency-based routing, geo DNS, weighted round-robin, and geo proximity. All these routing types can be easily combined with DNS Failover in order to enable a variety of low-latency, fault-tolerant architectures.

    Let us understand, step by step, how does AWS Route 53 work:

    • A user accesses www.example.com, an address managed by Route 53, which leads to a machine on AWS.

    • The request for www.example.com is routed to the user’s DNS resolver, typically managed by the ISP or local network, and is forwarded to a DNS root server.

    • The DNS resolver forwards the request to the TLD name servers for “.com” domains.

    Now, take a look at the benefits provided by Route 53.

    hashtag
    Amazon Route 53 Benefits

    Route 53 provides the user with several benefits.

    They are:

    • Highly Available and Reliable

    • Flexible

    • Simple

    Highly Available and Reliable

    • AWS Route 53 is built using AWS’s highly available and reliable infrastructure. DNS servers are distributed across many availability zones, which helps in routing end users to your website consistently.

    • Amazon Route 53 Traffic Flow service helps improve reliability with easy re-route configuration when the system fails.

    Flexible

    • Route 53 Traffic Flow provides users flexibility in choosing traffic policies based on multiple criteria, such as endpoint health, geographic location, and latency.

    Simple

    • Your DNS queries are answered by Route 53 in AWS within minutes of your setup, and it is a self-service sign-up.

    • Also, you can use the simple AWS Route 53 API and embed it in your web application too.

    • Distributed Route 53 DNS servers around the world make a low-latency service. Because they route users to the nearest DNS server available.

    Cost-effective

    • You only pay for what you use, for example, the hosted zones managing your domains, the number of queries that are answered per domain, etc.

    • Also, optional features like traffic policies and health checks are available at a very low cost.

    Designed to Integrate with Other AWS Services

    • Route 53 works very well with other services like and

    • For example, you can use Route 53 to map your domain names or IP addresses to your EC2 instances and Amazon S3 buckets.

    Secure

    • You can create and grant unique credentials and permissions to each and every user with your AWS account, while you have to mention who has access to which parts of the service.

    Scalable

    • Amazon Route 53 is designed to automatically scale up or down when the query volume size varies.

    These are the benefits that Amazon Route 53 provides, moving on with this what is Amazon Route 53 tutorial, let’s discuss the AWS routing policies.

    hashtag
    Amazon Route 53 Limitations

    Amazon Route 53 is a robust DNS service with advanced features, but it has several limitations as well. Some of them are discussed below:

    • No DNSSEC support: DNSSEC stands for Domain Name System Security Extensions. It is a suite of extensions specifications by the Internet Engineering Task Force. It is used to secure the data exchanged in DNS in Internet Protocol networks. It is not supported by AWS Route 53.

    • Forwarding options: Route 53 does not provide forwarding or conditional forwarding options for domains used on an on-premise network.

    • Single point of failure: Used in conjunction with other AWS services, Route 53 may become a single point of failure. This becomes a major problem for AWS route 53 disaster recovery and other relevant issues.

    hashtag
    AWS Route 53 Alternatives

    When buying a solution, buyers often compare and evaluate similar products by different market players based on certain parameters such as specific product capabilities, integration, contracting, ease of deployment, and offered support and services. Based on the mentioned parameters and a few more, we have listed some potential AWS Route 53 alternatives below:

    • Azure DNS: It allows you to host your DNS domain in Azure. This helps to manage DNS records by using the same credentials, billing, and support contract just as other Azure services.

    • Cloudflare DNS: As a potential alternative to AWS Route 53, Cloudflare DNS is described as the fastest, privacy-first consumer DNS service. It is a free-of-charge service for ordinary people; however, professionals and enterprises have to take up a monthly subscription.

    • Google Cloud DNS: Google Cloud DNS is a scalable, reliable, and managed authoritative DNS service that runs on the same infrastructure as Google.

    hashtag
    Does Avi Offer Route 53 Monitoring Capabilities?

    Avi Vantage is a next-generation, full-featured elastic application of that offers a range of application services such as security, monitoring and analytics, load balancing, and multi-cloud traffic management for workloads. All workloads are deployed in bare metal, virtualized, or container environments in a data center of a public cloud such as AWS. Avi Vantage delivers full-featured load balancing capabilities in an as-a-service experience and easily integrated Web Application Firewall (WAF) capabilities.

    Enterprises often leverage the power of AWS in order to maximize and modernize infrastructure utilization. The next phase of this modernization is represented by extending app-centricity to the networking stack.

    Avi Networks integrates with AWS Route 53 and delivers elastic application services that extend beyond load balancing to deliver real-time app and security insights, simplify troubleshooting, enable developer self-service, and automation.

    hashtag
    Amazon Route 53 Resolver for Hybrid Cloud

    The user merges a private center with one of their Amazon VPCs using a managed VPN or AWS Direct Connect in a typical hybrid cloud environment. As the private cloud and the user’s VPC is a pre-established connection to AWS, whenever a lookup is performed across this connection, it often fails. As a result, some users reroute requests using on-premises DNS servers to another Amazon VPC server. It can perform outbound communication from VPC to the data center and inbound communication from an on-premises source to VPC.

    Some of the advantages of AWS Route 53 resolver are as follows:

    Security: AWS benefits from the added security of Identity Access Management (IAM). allows secure user control access to all web resources and services. It can also assign specific permissions to allow or deny access to AWS resources and the creation and management of AWS users or groups.

    Cost: AWS Route 53 proves to be really cost-effective as it redirects website requests without extra hardware and does not charge for queries to distributions, ELBs, S3 buckets, VPC endpoints, and other AWS resources.

    Reliability: All features of Route 53, such as geographically-based and latency-based policies, are designed to be highly reliable and cost-effective. In addition to this, Amazon Route 53 is designed to help the system stay running in a coordinated way with all the other AWS services.

    hashtag
    AWS Routing Policies

    There are several types of routing policies. The below list provides the routing policies which are used by AWS Route 53.

    • Simple Routing

    • Latency-based Routing

    • Geolocation Routing

    Simple Routing

    Simple routing responds to DNS queries based only on the values in AWS route table. Use the simple routing policy when you have a single resource that performs a given function for your domain.

    Latency-based Routing

    If an application is hosted on EC2 instances in multiple regions, user latency can be reduced by serving requests from the region where network latency is the lowest. Create a latency resource record set for the Amazon EC2 resource in each region that hosts the application. Latency will sometimes change when there are changes in the routes.

    Interested in learning AWS? Go through this !

    Geolocation Routing

    Geolocation routing can be used to send traffic to resources based on the geographical location of users, e.g., all queries from Europe can be routed to the IP address 10.20.30.40. Geolocation works by mapping IP addresses, irrespective of regions, to locations.

    Now, you understood that Route 53 in AWS maps the end user to an IP address or a domain name. But, where are the routes stored?

    hashtag
    AWS Route Tables

    An AWS route table contains a set of rules or routes, which is used to determine where the network traffic is directed to.

    All subnets in your have to be attached to an AWS route table, and the table will take control of routing for those particular subnets. A subnet cannot be associated with multiple route tables at the same time, but multiple subnets can be connected with a single AWS route table. An AWS route table consists of the destination IP address and the target.

    These are the benefits provided by Route 53. What key features make Route 53 special?

    hashtag
    AWS Route 53 Key Features

    • Traffic Flow

    You can route end users to the best endpoint possible according to your application’s geo proximity, latency, health, and other considerations.

    • Latency-based Routing

    You can route end users to the AWS region with the lowest possible latency.

    • Geo DNS

    You can route your end users to the endpoint which is present in their specific region or the nearest geographic location.

    • DNS Failover

    You can route your end users to an alternate location to avoid website crashes or outages.

    • Health Checks and Monitoring

    The Health and performance of your website or application is monitored by Amazon Route 53. Your servers can be monitored as well.

    • Domain Registration

    You can search for and register available domain names using Amazon Route 53. A full list of currently available Top-level Domains (TLDs) are provided with the current pricing.

    hashtag
    Hands-on: Creating a Hosted Zone

    Step 1: Log in to the Step 2: Click on Route 53 in the Services drop-down

    Now, go to or any website for which you want to get a domain name. Freenom is completely free; for a demo, just use a domain from freenom.

    Step 3: Go to Route 53 dashboard and click on Create Hosted Zone

    Step 4: Provide the domain you have created in the domain field and keep the website as a public hosted site

    Step 5: Now, you will have a nameserver (NS) and Start of Authority (SOA) type recordsets. Copy the content of the nameserver value textbox and paste it in the Custom nameservers of your domain name

    After pasting nameservers, click on Change Nameservers.Remove the dots at the end of your nameserver values in both places

    Step 6: Create two recordsets with the type ‘A’ and leave one as the same. For the other, add ‘www’ so that both domain names redirect to the EC2 instance IP address you have provided. If you want to know how to create an EC2 instance, check out the AWS EC2 blog and do as per the hands-on steps mentioned there.

    Step 7: After completing all these steps perfectly, type the domain name in your browser’s URL tab. As you can see, the website is now online and available publicly on the Internet

    You have successfully hosted your first website!

    In this what is amazon route 53 in AWS, we have discussed the concepts of Route 53, how it works, what are AWS route tables and the key features provided by Amazon Route 53. Keep visiting for more tutorials on Services offered by AWS.

    SeMA Deployment Architecture

    A deployment architecture depicts the mapping of a logical architecture to a physical environment. The physical environment includes the computing nodes in an intranet or Internet environment, CPUs, memory, storage devices, and other hardware and network devices.

    Designing the deployment architecture involves sizing the deployment to determine the physical resources necessary to meet the system requirements specified during the technical requirements phase. You also optimize resources by analyzing the results of sizing the deployment to create a design that provides the best use of resources within business constraints.

    hashtag

    1. SeMA application sizing-estimation process .

    2. Deployment Logical Architecture .

    3. HW Sizing Specs .

    4. Deployment Process .

    hashtag

    hashtag
    Phishing simulations

    Beside introducing real-world customizable phishing simulations, Entrench offers anti-phishing behavior management feature which allows to measure awareness level of your employees.

    hashtag
    Training Modules

    Entrench training modules are offered in a variety of styles with full animation and narratives in many languages.

    hashtag
    Filmed Videos

    Security awareness sessions are no longer boring or dull. Sessions we offer based on (simplicity, Humor, ease of use and story-telling.

    hashtag
    Quizzes and Exams

    Entrench quizzes and exams can measure level of awareness that has been conveyed to the users.

    hashtag
    Customized Campaigns

    Awareness campaigns can be customized and targeted to either specific group of users or an entire department

    Zisoft is composed of several independent modules so you can pick and choose which modules you need to deploy. All modules are accessible from the same familiar user interface. The ZiSoft modules are

    1. Learning Management System

    2. Security Awareness Content

    3. Email Phishing Simulator

    hashtag
    Learning Management System

    Think of Zisoft LMS as your own private 'Coursera' or 'Udemy'. You use it to create courses complete with videos, slides, quizzes, exams, and certificates. Then you assign the courses to your employees and monitor their training in real-time. You can assign as many lessons you need to as many employees you need, and you can generate comprehensive reports in a variety of formats and charts.

    hashtag
    Security Awareness Content

    On top of the LMS, Zisoft offers 's security awareness content. These are predefined courses and exams that target security related topics. It offers 'Email Security', 'Data Leakage', 'Device Security', 'Browser Security', among many others.

    hashtag
    Email Phishing Simulator

    You are under a constant stream of phishing attacks whether you believe it or not. If you want to make sure, try our phishing simulator. With this simulator, you can send a 'controlled' and 'harmless' phishing email to a group of your organization users, and you can monitor in real time how many of them fall victim for those attacks. With the simulator, you can generate a report that tells you the percentage of your organization who is prone to phishing attacks, rank the departments according to their vulnerability, and conduct competitions for the employees to encourage them to be better at spotting phishing attacks.

    EC2 Auto Scaling

    Amazon EC2 Auto Scaling helps you ensure that you have the correct number of Amazon EC2 instances available to handle the load for your application. You create collections of EC2 instances, called Auto Scaling groups. You can specify the minimum number of instances in each Auto Scaling group, and Amazon EC2 Auto Scaling ensures that your group never goes below this size. You can specify the maximum number of instances in each Auto Scaling group, and Amazon EC2 Auto Scaling ensures that your group never goes above this size. If you specify the desired capacity, either when you create the group or at any time thereafter, Amazon EC2 Auto Scaling ensures that your group has this many instances. If you specify scaling policies, then Amazon EC2 Auto Scaling can launch or terminate instances as demand on your application increases or decreases.

    For example, the following Auto Scaling group has a minimum size of one instance, a desired capacity of two instances, and a maximum size of four instances. The scaling policies that you define adjust the number of instances, within your minimum and maximum number of instances, based on the criteria that you specify.

    For more information about the benefits of Amazon EC2 Auto Scaling, see Amazon EC2 Auto Scaling benefitsarrow-up-right.

    hashtag
    Auto Scaling components

    The following table describes the key components of Amazon EC2 Auto Scaling.

    hashtag
    Pricing for Amazon EC2 Auto Scaling

    There are no additional fees with Amazon EC2 Auto Scaling, so it's easy to try it out and see how it can benefit your AWS architecture. You only pay for the AWS resources (for example, EC2 instances, EBS volumes, and CloudWatch alarms) that you use.

    hashtag
    Get started

    To begin, complete the tutorial to create an Auto Scaling group and see how it responds when an instance in that group terminates.

    hashtag
    Related services

    To automatically distribute incoming application traffic across multiple instances in your Auto Scaling group, use Elastic Load Balancing. For more information, see .

    To monitor your Auto Scaling groups and instance utilization data, use Amazon CloudWatch. For more information, see .

    To configure auto scaling for scalable resources for Amazon Web Services beyond Amazon EC2, see the .

    hashtag
    Work with Auto Scaling groups

    You can create, access, and manage your Auto Scaling groups using any of the following interfaces:

    • AWS Management Console – Provides a web interface that you can use to access your Auto Scaling groups. If you've signed up for an AWS account, you can access your Auto Scaling groups by signing into the AWS Management Console, using the search box on the navigation bar to search for Auto Scaling groups, and then choosing Auto Scaling groups.

    • AWS Command Line Interface (AWS CLI) – Provides commands for a broad set of AWS services, and is supported on Windows, macOS, and Linux. To get started, see . For more information, see in the AWS CLI Command Reference.

    Elastic File System

    hashtag
    What is Amazon Elastic File System?

    Amazon Elastic File System (Amazon EFS) provides serverless, fully elastic file storage so that you can share file data without provisioning or managing storage capacity and performance. Amazon EFS is built to scale on demand to petabytes without disrupting applications, growing and shrinking automatically as you add and remove files. Because Amazon EFS has a simple web services interface, you can create and configure file systems quickly and easily. The service manages all the file storage infrastructure for you, meaning that you can avoid the complexity of deploying, patching, and maintaining complex file system configurations.

    Amazon EFS supports the Network File System version 4 (NFSv4.1 and NFSv4.0) protocol, so the applications and tools that you use today work seamlessly with Amazon EFS. Multiple compute instances, including Amazon EC2, Amazon ECS, and AWS Lambda, can access an Amazon EFS file system at the same time. Therefore, an EFS file system can provide a common data source for workloads and applications that are running on more than one compute instance or server.

    With Amazon EFS, you pay only for the storage used by your file system and there is no minimum fee or setup cost. Amazon EFS offers a range of storage classes designed for different use cases. These include:

    • Standard storage classes – EFS Standard and EFS Standard–Infrequent Access (Standard–IA), which offer Multi-AZ resilience and the highest levels of durability and availability.

    • One Zone storage classes – EFS One Zone and EFS One Zone–Infrequent Access (EFS One Zone–IA), which offer you the choice of additional savings by choosing to save your data in a single Availability Zone.

    For more information, see . Costs related to Provisioned Throughput are determined by the throughput values that you specify. For more information, see .

    Amazon EFS is designed to provide the throughput, IOPS, and low latency needed for a broad range of workloads. With Amazon EFS, you can choose from two performance modes and three throughput modes:

    • The default General Purpose performance mode is the recommended mode. General Purpose is ideal for latency-sensitive use cases, like web-serving environments, content-management systems, home directories, and general file serving.

    • File systems in the Max I/O performance mode can scale to higher levels of aggregate throughput and operations per second. However, these file systems have higher latencies for file system operations. For more information, see .

    The service is designed to be highly scalable, highly available, and highly durable. Amazon EFS file systems using Standard storage classes store data and metadata across multiple Availability Zones in an AWS Region. EFS file systems can grow to petabyte scale, drive high levels of throughput, and allow massively parallel access from compute instances to your data.

    Amazon EFS provides file-system-access semantics, such as strong data consistency and file locking. For more information, see . Amazon EFS also supports controlling access to your file systems through Portable Operating System Interface (POSIX) permissions. For more information, see .

    Amazon EFS supports authentication, authorization, and encryption capabilities to help you meet your security and compliance requirements. Amazon EFS supports two forms of encryption for file systems: encryption in transit and encryption at rest. You can enable encryption at rest when creating an Amazon EFS file system. If you do, all your data and metadata is encrypted. You can enable encryption in transit when you mount the file system. NFS client access to EFS is controlled by both AWS Identity and Access Management (IAM) policies and network security policies, such as security groups. For more information, see , , and .

    EC2 placement group

    When you launch a new EC2 instance, the EC2 service attempts to place the instance in such a way that all of your instances are spread out across underlying hardware to minimize correlated failures. You can use placement groups to influence the placement of a group of interdependent instances to meet the needs of your workload. Depending on the type of workload, you can create a placement group using one of the following placement strategies:

    • Cluster – packs instances close together inside an Availability Zone. This strategy enables workloads to achieve the low-latency network performance necessary for tightly-coupled node-to-node communication that is typical of high-performance computing (HPC) applications.

    • Partition – spreads your instances across logical partitions such that groups of instances in one partition do not share the underlying hardware with groups of instances in different partitions. This strategy is typically used by large distributed and replicated workloads, such as Hadoop, Cassandra, and Kafka.

    • Spread – strictly places a small group of instances across distinct underlying hardware to reduce correlated failures.

    There is no charge for creating a placement group.

    hashtag
    Placement group strategies

    You can create a placement group using one of the following placement strategies:

    hashtag
    Cluster placement groups

    A cluster placement group is a logical grouping of instances within a single Availability Zone. A cluster placement group can span peered virtual private networks (VPCs) in the same Region. Instances in the same cluster placement group enjoy a higher per-flow throughput limit for TCP/IP traffic and are placed in the same high-bisection bandwidth segment of the network.

    The following image shows instances that are placed into a cluster placement group.

    Cluster placement groups are recommended for applications that benefit from low network latency, high network throughput, or both. They are also recommended when the majority of the network traffic is between the instances in the group. To provide the lowest latency and the highest packet-per-second network performance for your placement group, choose an instance type that supports enhanced networking. For more information, see .

    We recommend that you launch your instances in the following way:

    • Use a single launch request to launch the number of instances that you need in the placement group.

    • Use the same instance type for all instances in the placement group.

    If you try to add more instances to the placement group later, or if you try to launch more than one instance type in the placement group, you increase your chances of getting an insufficient capacity error.

    If you stop an instance in a placement group and then start it again, it still runs in the placement group. However, the start fails if there isn't enough capacity for the instance.

    If you receive a capacity error when launching an instance in a placement group that already has running instances, stop and start all of the instances in the placement group, and try the launch again. Starting the instances may migrate them to hardware that has capacity for all of the requested instances.

    hashtag
    Partition placement groups

    Partition placement groups help reduce the likelihood of correlated hardware failures for your application. When using partition placement groups, Amazon EC2 divides each group into logical segments called partitions. Amazon EC2 ensures that each partition within a placement group has its own set of racks. Each rack has its own network and power source. No two partitions within a placement group share the same racks, allowing you to isolate the impact of hardware failure within your application.

    The following image is a simple visual representation of a partition placement group in a single Availability Zone. It shows instances that are placed into a partition placement group with three partitions—Partition 1, Partition 2, and Partition 3. Each partition comprises multiple instances. The instances in a partition do not share racks with the instances in the other partitions, allowing you to contain the impact of a single hardware failure to only the associated partition.

    Partition placement groups can be used to deploy large distributed and replicated workloads, such as HDFS, HBase, and Cassandra, across distinct racks. When you launch instances into a partition placement group, Amazon EC2 tries to distribute the instances evenly across the number of partitions that you specify. You can also launch instances into a specific partition to have more control over where the instances are placed.

    A partition placement group can have partitions in multiple Availability Zones in the same Region. A partition placement group can have a maximum of seven partitions per Availability Zone. The number of instances that can be launched into a partition placement group is limited only by the limits of your account.

    In addition, partition placement groups offer visibility into the partitions — you can see which instances are in which partitions. You can share this information with topology-aware applications, such as HDFS, HBase, and Cassandra. These applications use this information to make intelligent data replication decisions for increasing data availability and durability.

    If you start or launch an instance in a partition placement group and there is insufficient unique hardware to fulfill the request, the request fails. Amazon EC2 makes more distinct hardware available over time, so you can try your request again later.

    hashtag
    Spread placement groups

    A spread placement group is a group of instances that are each placed on distinct hardware.

    Spread placement groups are recommended for applications that have a small number of critical instances that should be kept separate from each other. Launching instances in a spread level placement group reduces the risk of simultaneous failures that might occur when instances share the same equipment. Spread level placement groups provide access to distinct hardware, and are therefore suitable for mixing instance types or launching instances over time.

    If you start or launch an instance in a spread placement group and there is insufficient unique hardware to fulfill the request, the request fails. Amazon EC2 makes more distinct hardware available over time, so you can try your request again later. Placement groups can spread instances across racks or hosts. You can use host level spread placement groups only with AWS Outposts.

    Rack spread level placement groups

    The following image shows seven instances in a single Availability Zone that are placed into a spread placement group. The seven instances are placed on seven different racks, each rack has its own network and power source.

    A rack spread placement group can span multiple Availability Zones in the same Region. For rack spread level placement groups, you can have a maximum of seven running instances per Availability Zone per group.

    EC2 Lab with EFS shared

    Cloud Watch

    hashtag
    What is CloudWatch?

    • CloudWatch is a service used to monitor your AWS resources and applications that you run on AWS in real time. CloudWatch is used to collect and track metrics that measure your resources and applications.

    AWS LB

    hashtag
    What is Load Balancer?

    Load Balancer is a virtual machine or appliance that balances your web application load that could be Http or Https traffic that you are getting in. It balances a load of multiple web servers so that no web server gets overwhelmed.

    It displays the metrics automatically about every AWS service that you choose.
  • You can create the dashboard to display the metrics about your custom application and also display the metrics of custom collections that you choose.

  • You can also create an alarm to watch metrics. For example, you can monitor CPU usage, disk read and disk writes of Amazon EC2 instance to determine whether the additional EC2 instances are required to handle the load or not. It can also be used to stop the instance to save money.

  • hashtag
    Following are the terms associated with CloudWatch:

    • Dashboards: CloudWatch is used to create dashboards to show what is happening with your AWS environment.

    • Alarms: It allows you to set alarms to notify you whenever a particular threshold is hit.

    • Logs: CloudWatch logs help you to aggregate, monitor, and store logs.

    • Events: CloudWatch help you to respond to state changes to your AWS resources.

    With the default
    Bursting Throughput mode
    , throughput scales with the amount of storage in your file system and supports bursting to higher levels for up to 12 hours per day.
  • With Elastic Throughput mode, Amazon EFS automatically scales throughput performance up or down to meet the needs of your workload activity.

  • With Provisioned Throughput mode, you specify a level of throughput that the file system can drive independent of the file system's size or burst credit balance. For more information, see Throughput modesarrow-up-right.

  • EFS storage classesarrow-up-right
    Amazon EFS Pricingarrow-up-right
    Performance modesarrow-up-right
    Data consistency in Amazon EFSarrow-up-right
    Security in Amazon EFSarrow-up-right
    Data encryption in Amazon EFSarrow-up-right
    Identity and access management for Amazon Elastic File Systemarrow-up-right
    Controlling network access to Amazon EFS file systems for NFS clientsarrow-up-right

    To create & operate a virtual private server with AWS using the simplest method available. A cloud platform that includes everything you need to create an application or website.

    Batch

    Allows developers, scientists, and engineers to create and run hundreds of thousands of batch processing jobs on Amazon Web Services (AWS)

    Containers

    Elastic Container Service (ECS)

    A scalable, secure, and highly efficient way to run containers.

    Elastic Container Registry (ECR)

    You can store, manage, and deploy container images easily.

    Elastic Kubernetes Service (EKS)

    A fully managed service.

    Fargate

    Its is used as Serverless compute for containers

    Serverless

    Lambda

    Pay only for the compute time you consume, instead of running code without thinking about servers.

    Edge and hybrid

    Outposts

    You can have a truly consistent hybrid experience with AWS infrastructure and services on your own premises.

    Snow Family

    Formalise, process, and store data in rugged or disconnected edge environments.

    Wavelength

    It is used to deliver ultra-low latency applic­ation in devices using 5G

    VMware Cloud on AWS

    Work faster by innovating faster, rapidly shifting to the cloud, and securely working from anywhere.

    Local Zones

    It runs latency-sensitive applic­ations closer to the end-users.

    AWS Storage Gateway

    A storage gateway enables an on-premise software appliance to communicate with cloud-based storage. It provides an edge-­led, no-­premium, high-­speed connection between the software and storage provider, allowing for a more cost-­effective and efficient delivery of software and data to customers. The service can be accessed via a mobile device or web browser and eliminates the need for customers to maintain large, expensive on-premises data centres. Some of the benefits of using a data centre as opposed to a cloud provider include lower costs, longer operational flexibility due to lower operational costs, and availability of human resources for support. A data centre can be more than just a place to park servers. It can be a hub for other business processes, enabling a higher level of integration between the data and the applications that generate it.

    AWS DataSync

    DataSync is simple and efficient data transfer between on-premises storage and S3, EFS, or FSx for Windows File Server. DataSync can also be used to migrate your on-premises data to S3 and other cloud storage providers. DataSync offers both a server software and client software option. With the client software, you can create a disconnected storage pool and then connect the server to the storage pool using DataSync. With the server software, you can create a disconnected storage pool and then connect the storage pool to the on-premises data hub using DataSync.

    AWS Transfer Family

    Transfer Family is designed to provide seamless file transfers into & out of S3.

    AWS Snow Family

    Snow Family devices are highly­-sec­ured, port­able com­puters that collect and trans­mit data at the edge, and migrate data between AWS and other systems.

    Coding Leadeboards

    Elasti­Cache for Memcached & Redis

    Elasti­Cache is a tool for web application accelerat­ing the process of setting up and populating an in-memory cache with data. You can use it to speed up page loads and to make your application more responsive. Elasti­Cache is a centralised tool for setting up and populating an in-memory cache with data. You can use it to speed up page loads and to make your application more responsive.

    Document

    Content Management

    DocumentDB

    DocumentDB provides a complete turnkey solution for building data-based apps at scale, with the ability to scale up or down as needed to meet the needs of your business. It can be used to store almost any data, including big data, as well as run serverless SQL query against the data. It's scalable, efficient, and easy to use. It's also open source and community driven, so if you have any suggestions or feedback, don't be afraid to drop a line.

    Wide column

    Fleet management system

    Keyspaces (for Apache Cassandra)

    Keyspacesis is designed to be used in tandem with Apache Cassandra as the primary database for high-throughput workloads. The key to using Key­ Spaces is the isolation of data between the different applications that use it. The data is held in a single database instance, but applications can use different databases (such as Redis or CouchDB) to store their data in a different system. Key­ Spaces is a highly available database service, which means that if there is a failure in the primary database, other key­ spaces can continue to operate with minimal impact to the application.

    Graph

    Recommender Engines

    Neptune

    Neptune uses a hybrid database model that stores data in the form of graphs and allows users to query data in a variety of ways, such as by using a SQL-like query language. Users can choose how their data is stored, and how it is accessed, by using Neptune’s Storage & Access Management (SAM) tool. Neptune is available in a private and open-source version, as well as a closed-source version. The open-source version is licensed under the Apache 2.0 licence, and the closed-source version is licensed under the GPL licence.

    Time series

    IoT devices and applications

    Timestream

    With Timestream, you can record, manage, and analyse billions of events per day in a fast, simple, and serverless manner.

    Ledger

    Transaction Management

    Quantum Ledger Database (QLDB)

    A QLDB is a transparent, immutable, and cryptographically verifiable transaction log owned by a central trusted authority. It provides a transparent, incorrupt, and cryptol­ogue­ment verified record.

    CodeCommit

    CodeCommit is a Git repository service that supports storing and managing Git archives on the Amazon Web Services cloud with CodeCommit.

    CodeDeploy

    CodeDeploy, a professionally managed deployment service, automates software installations on a variety of EC2, Fargate, Lambda, and on-premises servers.

    CodePi­peline

    CodePipeline is a high-quality, automated release pipeline that helps automate app and infra update release pipelines.

    CodeStar

    With AWS CodeStar, you can create, manage, and scale automated code reviews with a single click. You can also monitor the performance and scalability of your code review process with the built-in metrics dashboard.

    CLI

    AWS CLI is a command tool that helps you manage multiple AWS services and automate them using scripts. It offers a simple yet powerful interface for managing multiple AWS services and a set of built-in commands that enables you to easily create and delete EC2 instances, cancel auto-scaling, and more.

    X-Ray

    X-Ray allows software engineers to view the state of a system at a glance, identify potential bottlenecks, and make informed operational decisions to improve performance and reliability. X-Ray inspects application code using a combination of machine and customer-provided data to identify potential bottlenecks and analyse performance and performance trends for each test scenario.

    Route 53

    Route 53 is a dedicated, real-time DNS service that allows you to focus on building an incredible Internet experience for your customers, partners, and vendors. It is a highly available, enterprise grade cloud DNS solution that provides load balancing, failover, high availability and performance monitoring to ensure optimal service for your customers and partners.

    Scale your network design

    Elastic Load Balancing

    Elastic Load Balancing is a best practice to assign incoming traffic to a single target, such as an EC2 Instance, and then distribute the rest of the traffic across the target's resources. An elastic load balancer distributes traffic across an arbitrary number of targets.

    Global Accele­rator

    Global Accele­rator connects Amazon's global infrastru­cture to the global traffic-generation network of Global Accele­rator, improving internet performance by up to 60%.

    Secure your network traffic

    Shield

    Shield inspects the source and destination IP addresses of every request to a protected resource, and blocks malicious requests from either IP address if it suspects them to be from the same source. This helps to prevent DoS attacks, and also safeguards your sensitive data from being leaked on a public website by refusing to provide a response to requests from maliciously IPed websites.

    WAF

    WAF is a web applic­ation firewall that protects your API endpoints by blocking malicious requests and whitelisting trusted requests. It can be run as a service on your favourite cloud hosting provider or as a task on your favourite work-from-home platform.

    Firewall Manager

    Firewall Manager provides centralised control, auditing, and visibility over your AWS security policies and rules. It can be used to monitor, limit the usage of specific services for security purposes, or to enforce specific policies on specific traffic.

    Build a hybrid IT network

    (VPN) - Client

    VPNs protect your privacy online, and also provide a secure way to access network resources when needed. For example, your corporate VPN provides a secure connection to the company intranet when needed, but doesn’t typically expose your online activity to the public internet.. AWS provides a rich set of tools for building and managing VPNs, and it’s easy to get started with the AWS VPN Service.

    (VPN) - Site to Site

    Site-to-Site VPN makes a secure connection between a data centre or branch office and AWS cloud resources.

    Direct Connect

    Direct Connect allows you to set up and manage a secure, private, and fault-tolerant network connection between your AWS and on-premises devices.

    Content delivery networks

    CloudFront

    CloudFront is a distributed content delivery network (CDN) that enables easy delivery of web content to end users from a pool of web servers around the globe

    Build a network for micros­ervices archit­ectures

    App Mesh

    AWS microservice-based App Mesh makes it possible to guide and control App Mesh-based microservices on AWS.

    API Gateway

    API Gateway provides the opportunity to create and expand your own REST and WebSocket APIs at any size.

    Cloud Map

    The cloud map handles the name and addresses of the clouds.

    Directory Service

    AWS Managed Microsoft Active Directory (MMAD) enables you to use Active Directory across your entire enterprise with an emphasis on security and regulatory compliance.

    Resource Access Manager

    Resource Access Manager (RAM)allows you to assign access control rules to resources so that only authorised users can access them. You can also set rules to assign specific users access to resources based on topic, role, or condition.

    Organisations

    As your environment grows and scales, organisations help you centrally manage your environment.

    Detection

    Security Hub

    AWS IoT Security Hub can help you improve your security posture by monitoring the state of your applications and devices, and alerting you to any potential issues. You can view the state of your applications and devices, as well as receive notifications on potential issues, via a dashboard.

    GuardDuty

    GuardDuty reduces the risk of malicious activity and data breaches by proactively monitoring the AWS accounts, workloads, and storage in the cloud. AWS GuardDuty continuously watches for malicious activity, like unusual activity in the source IP address list, or abnormal activity in the number of notification emails received. It can also be used to proactively detect unauthorised behaviour, like a large influx of traffic to a particular AWS account or a significant increase in the number of notifications about an unauthorised change in access controls.

    Inspector

    It scans your AWS environment for potential security vulnerabilities, and offers remediation suggestions. It includes detailed analysis, including vulnerability severity, impact, and recommended action. You can use the online survey at the start of the report to rate the severity of the vulnerability. Inspectors can be used for every type of AWS service, but our researchers found that most of them are useful for VPCs and EC2 instances. Once an Inspector has been launched, you can get the details about the vulnerability, including the details about the root cause such as the AWS SDKs, the processes that were vulnerable and the actions that were taken.

    Config

    It is a free service that allows you to monitor, bill for, and adjust the settings of Amazon Web Services (AWS) resources from the comfort of your own desk. The service works by detecting and recording metadata about every action that a resource takes, like creation, modification, or removal. This information is then analysed to determine the impact that each action has on other resources. You can use this monitoring data to: Assess the health of your AWS resources and identify areas for rapid development and transformation.

    CloudTrail

    It records all the actions that a given AWS account has been taken in a given period of time. It provides a historical record of the actions taken by a given AWS account in a given period of time, allowing you to view which accounts have been accessing your resources, who has been accessing your resources, and for how long. You can also generate detailed spending reports for your account and see which spenders are making the biggest impacts on your bottom line. You can view a detailed report of all your actions taken within a given time period or drill down into the data to view actions taken by an account within a specific period of time.

    IoT Device Defender

    It monitors and secures connected devices from a security standpoint. It proactively blocks malicious or unsafe apps from being installed on connected devices, and controls the data that is being transmitted between the device and the cloud. It tracks the usage of connected devices, and ensures that data privacy is protected.

    Infras­tru­cture protection

    Shield

    Apps protected with Shield are continuously monitored for unusual traffic patterns, such as high-latency or unusual traffic patterns. When an abnormal pattern is detected, Shield automatically detects the attack, identifies the origin of the traffic, and identifies the threat vector. It then applies a variety of mitigations to prevent or reduce the impact of the attack.

    Web Applic­ation Firewall (WAF)

    WAF provides a set of rules that can be configured to block or allow requests based on their set of rules. Rules can be configured as either Whitelists or Blacklists. Whitelists allow for greater control and transparency while Blacklists are limited in their ability to adapt to changes in threat patterns. An API can be made subject to WAF rules through an API Management Gateway (AGW) or an Application Firewall (AFW) can be implemented within the hosting provider's infrastructure.

    Firewall Manager

    It provides a single point of access to view, manage, and control the whole AWS WAF lifecycle from the user's perspective. It provides an overview of the current state of the WAF, as well as a list of maintenance steps the user can take to adjust the configuration or launch a fresh audit. Once the user has accepted the terms and conditions, the plugin will create a new instance of Firewall Manager on the user's behalf. This instance includes all the necessary AWS services to enable the WAF and provide a secure environment.

    Data protection

    Macie

    It is a one-stop-shop for your data protection needs. Macie monitors data at rest and in process, as well as in motion, across your organisation’s networks, devices and apps. It continuously scans the data it receives for patterns that indicate the presence of malicious or objectionable content, and notifies the user when it detects such content. Macie also provides you with a host of other data protection services, like data encryption, data integrity, data profiling, data governance, data auditing, data erasure, data shredding, data melting, data harvest, data collation, data transformation, and data rental.

    Key Management Service (KMS)

    Key management on AWS is a broad range of activities from creating & storing public & private keys to creating, managing, and authorising access to AWS services with digital keys. This guide explains the key management solution on AWS that is easiest to use, most secure, and provides the most flexibility for you to create and manage your keys the way you need them.

    CloudHSM

    This is particularly useful for mobile devices and other unsecured, remote-­accessed devices. CloudHSM is a blockchain-based smart contract that secures and manages your data, identity, and access control. It comes with a host of features including a one-click setup, cloud storage, SaaS solution, and a mobile app.

    Certif­icate Manager

    Certif­icate Manager provides a single, easy-to-use interface for managing and deploying TLS/SSL certificates. Manage certificates with a single click from the dashboard or from the command line with certif­icate manager-cli . Automate certificate renewals with the built-in cron jobs. You can also manage certificates through the API or the command line interface. Certif­icate Manager can be deployed as a cloud-based service or on-premises with a virtual machine. Once up and running, you can manage and deploy certificates through the web interface or the API.

    Secrets Manager

    Secrets Manager allows you to securely store, access, & share secrets with a single-click. It is a flexible tool that allows you to set permissions for storing and accessing secrets. It can be used to store and share secrets between your services, between your apps, or between your backend & frontend code.

    Incident response

    Detective

    Detectives can easily look at, investigate, and quickly identify potential security problems or suspicious activities.

    CloudE­ndure Disaster Recovery

    It can be used to protect your data from power outages, network outages, or any other disaster. It can also be used for disaster recovery for your business data centers. Disaster recovery can also be used to restore a server to its previous state to avoid the loss of data in the event of a server crash or other external causes. In order to be used for disaster recovery, a server must be provisioned with the appropriate hardware and software, and must be properly configured for disaster recovery.

    Compliance

    Artifact

    You can use the Artifact web service to view and download AWS security and compliance records. The service returns an XML response that includes information about the record such as the AWS access and identity credentials that was used to create the record, the version of the record, the AWS Security Token used to access the record, the AWS Security Group used to protect the record and other metadata.

    CloudE­ndure Migration

    Cloud Endure Migration simpli­fies the task of deploying new software in the cloud by removing the need to transfer data from one location to another. With Cloud Endure Migration, you can: - Simplify the inventory process by tagging and tracking your assets with custom metadata. - Reduce the cost of relocation by streamlining the transfer of data with a minimum of effort.

    VMware Cloud on AWS

    Refer to the compute section. It has already been explained there.

    DataSync

    Refer to the storage section. It has already been explained there.

    Transfer Family

    Refer to the storage section. It has already been explained there.

    Snow Family

    Refer to the storage section. It has already been explained there.

    Control

    Set up effective governance mechanisms with the right guardrails in place

    A central authority is established and managed to govern an AWS environment as it grows and scales workloads on the platform.

    Forecast

    Create estimated resource usage and forecast dashboards

    You can create a forecast for the next 90 days, one month, two months, or even for the lifetime of your account. The forecast will show how much data you will need to store, how much you will use each month, and how much you will spend on AWS during the forecast month. You can view a history of your forecasts or create a new one. You can also get a breakdown of your costs and usage by region, country, or by describing your business needs in more detail. You can create a forecast for any length of time, but a short one will give you the most up-to-date information and save you the time of creating a new forecast each month.

    Budget

    Set custom budget threshold, auto alert notification on spend higher than threshold, and keep track of keep spend in check with a custom budget threshold.

    Budgets can be set to track cost and usage in any manner from the simplest to the most challenging applications.

    Purchase

    Use free trials and programmatic discounts based on workload pattern and need to leverage free trials and progra­mmatic discounts.

    A reserved instance provides up to 75% off on-demand pricing

    Elasticity

    Devise plans to meet or exceed consumer demand by understanding and responding to its patterns and needs.

    When you're setting up a new AWS account and want to start experimenting with Amazon's platform, you can trust that the experience provided by this website will help you get the most out of your experience. This includes getting the best domain name, choosing the right location for your testing site, and choosing a secure hosting solution. By following these tips, you can feel confident that your experience with the AWS platform is as smooth as possible.

    Rightsize

    Prioritize workload allocation size to meet demand.

    AWS offers a variety of options for optimi­zing your compute resources - from on-premises equipment to cloud solutions - to help you get the best possible performance from your infrastructure. For example, you can use virtual machines with vMotion capability to transfer your workloads between data centers more efficiently. You can also use cloud metering to collect and report performance metrics on your use of compute resources.

    Inspect

    To keep up-to-date on resource deployment and cost offsetting opportunities

    Cost Explorer helps you understand your current and future cost structure by automatically detecting and outlining your current & future spend on cloud services such as Amazon Web Services and more. You can also create a detailed report that breaks down your spending by month, by asset, or by location — making it easy to understand and visualizing your cloud costs.

    Kinesis

    Kinesis makes it easy to collect data using any of the following options: web sites, email, text messages, sensors, or even in-app purchase data. One can then process the collected data with tools such as SQL or NoSQL, integrate the data with tools such as artificial intelligence, and display the data in a variety of ways. Kinesis also makes it easy to analyze the data with tools such as artificial intelligence, machine learning, and blockchain technology. By providing the ability to process and analyze data in real-time, Kinesis allows businesses to react to changing situations and market trends faster than before.

    Elasti­csearch Service

    Elasti­csearch Service is simple to set up, deploy, and operate at large scale. Elasti­csearch Service is a managed service that makes it simple to operate, secure, and maintain Elasti­csearch at a high level of efficiency.

    Quicksight

    QuickSight makes it simple to send information to everyone in your company by utilizing the cloud-based business intelligence service QuickSight.

    Data movement

    1) Amazon Managed Streaming for Apache Kafka (MSK)

    2) Kinesis Data Streams

    3) Kinesis Data Firehose

    4) Kinesis Data Analytics

    5) Kinesis Video Streams

    6) Glue

    MSK is a simple framework that makes it simple to build and run Apache Kafka applications.

    Data lake

    1) S3

    2) Lake Formation

    Setting up a data lake is simple with Lake Formation. It makes it straightforward to create a secure data lake in minutes. A data lake is a centralized, curated, and secured repository for all data, both in its original form and prepped for analysis.

    1) S3 Glacier

    2) Backup

    These S3 cloud storage classes are designed for small- and medium-sized businesses that need a cost-effective and high-performance cloud storage solution for their data archives & long-term backup purposes. These S3 cloud storage classes are designed for small- and medium-sized businesses that need a cost-effective and high-performance cloud storage solution for their data archives & long-term backup purposes.

    1) Glue

    2) Lake Formation

    Refer as above.

    Data Exchange

    Data Exchange is a cloud-based software that provides a simple and easy-to-use interface for handling data interactions with a view to increasing your data’s scalability and optimizing your business. It allows you to: - Find, list, search, and subscribe to data - Store data in the cloud - Query data - Process data - Export data Data Exchange is a cloud-based software that provides a simple and easy-to-use interface for handling data interactions with a view to increasing your data’s scalability and optimizing your business. It allows you to: Find, list, search, and subscribe to data Store data in the cloud Query data Process data Export data

    Predictive analytics & machine learning

    Deep Learning AMIs

    Deep learning is a machine learning field of study that applies artificial intelligence and iterative learning algorithms to large data sets to generate new knowledge. AI and ML are being used in a variety of industries, including finance, retail, and manufacturing, to name a few. By using AMI’s, AI researchers can train their models on any of the many Cloud Storage resources, provided they have access to the right storage format.

    SageMaker

    SageMaker automates all the necessary steps to build, test, deploy, and scale your models including: model selection, preprocessing, meta-learning, visualization, and inference. SageMaker provides a full end-to-end solution for data analysis, data preparation, model training, and real-time visualizations of your data.

    Run containers without managing servers

    Fargate

    The Fargate stack consists of a number of components which work together to create a highly available, low-cost, and secure business-grade application. It is designed to work with both ECS & EKS. We will cover the different components of the Fargate stack and the best practices to maintain a successful Fargate stack.

    Run containers with server­-level control

    EC2

    Refer to the compute section. It has already been explained there.

    Contai­nerize and migrate existing applic­ations

    App2Co­ntainer

    A2C helps you to: - Minimise the risk of security flaws by generating a self-signed certificate for every application. - Minimise the cost of installing customised java and .NET applications by generating the same unique code signing key for every application that is installed. - Automate application upgrades by generating the same code signing key for every application that is installed. - Generate a single update for all your apps to download and install. - Reduce the overall cost of maintaining your apps by using the same code signing key for every app.

    Quickly launch and manage contai­nerized applic­ations

    Copilot

    It helps you manage your application’s life cycle from development to deployment, and enables you to make smarter and faster decisions during the application life-cycle. The interface is based on a set of common operations such as creating, deploying, and managing application containers, creating and terminating IAM permissions, and creating and listing clusters. It also provides support for common use cases such as batch processing, AI and ML, and secure data storage. This dashboard provides information about your clusters and applications, such as memory usage, CPU usage, and how long each application took to provision. The info helps you identify bottlenecks, optimise application performance, and create high-performing clusters.

    Storage

    S3

    Refer to the storage section. It has already been explained there.

    EFS

    Refer to the storage section. It has already been explained there.

    Data stores

    DynamoDB

    DynamoDB is a NoSQL database that is designed to work with JavaScript. It is a highly scalable database that can be used to store huge amounts of data and still be fast. As more data is added to the database, the performance of the database also increases. In order to use this database, you must first create a database account and sign up for a free trial.

    Aurora Serverless

    Aurora Serverless is a serverless computing platform that eliminates the need for manually managing infrastructure and automates critical steps of a serverless infrastructure implementation, such as creating a config­uration blueprint and selecting a provider. It helps you scale your software without scaling infrastructure. You can use Serverless to create an entire development and test environment, or you can use it to create a production-level application with the same codebase and same data, with the same engineers, testing in the same environment, and deployments across the same clusters.

    RDS Proxy

    The RDS Proxy can be used to:

    Manage a single database across multiple clusters

    Reduce costs by reducing the number of nodes in your RDS infrastructure

    Enable high availability of your RDS clusters

    Enable self managed storage for your RDS clusters

    Speed up your application deployments

    API Proxy

    API Gateway

    API Gateway works with any language or platforms that can communicate with the Google Cloud Platform. It can be used to create APIs both for internal and external clients, as well as absorb & route traffic if desired. It is a perfect fit for growing businesses or teams that need to build and manage an API programmatically.

    Applic­ation integr­ation

    SNS

    SNS facilitates the exchange of data between apps and devices using standardized APIs. You can create SNS topics and send and receive messages using SNS clients and servers. SNS provides security and control over messages that are not tagged with certain topics or sent from certain clients. With SNS, you can: Send and receive messages with a simple interface Control which devices can send messages, who can read them, etc. Access and view messages and conversations from different clients & devices at the same time.

    SQS

    With SQS, you can send messages between applications and services, route them to the right recipient, and keep track of the source & target addresses. It’s similar to Slack or Hipchat but it’s not a replacement for those popular chatting apps. SQS is a message queuing solution that enables you to decouple microservices, distributed systems, & serverless applications.

    AppSync

    It's simple to create GraphQL APIs with AppSync, which handles the hard work of securely connecting to data sources such as AWS DynamoDB, Lambda.

    EventB­ridge

    It is a low-cost alternative to building a new backend infrastructure for every new app. With Serverless EventB­ridge, you can connect your existing apps with a few lines of code. You don’t have to build a new backend for every new app you want to connect to. You can use existing infrastructure as a provider of event data, and connect your apps using Serverless EventB­ridge.

    Orches­tration

    Step Functions

    Step Functions is an easy-to-use function orchestra that makes it possible to string Lambda functions and multiple AWS services into business-critical applications.

    Analytics

    Kinesis

    Kinesis enables one to get timely insights by collecting, processing, and analyzing real-time, streaming data.

    Athena

    Athena provides a high-level language that allows users to quickly and easily set up and operate their S3 data analysis. With Athena, you can view data in Amazon S3 using standard SQL queries. This allows you to save time by not having to learn a new data analytics software.

    Workflows

    Step Functions

    Serverless workflows let you create and update apps from code without handling requests from clients. When you’re working with serverless, you can create one serverless process that handles requests from your clients and another that updates the app logic.

    Serverless workflows are a great way to keep your code simple while still letting you respond to requests from clients. You can use serverless to build your apps without worrying about scalability, performance, or security.

    API management

    API Gateway

    Build a secure API that allows users to manipulate, manipulate, & combine data from one or more data sources.

    AppSync

    Create a flexible API to securely access, manipu­late, & combine data from one or more data sources

    Event bus

    EventB­ridge

    Connect application data from your own apps, SaaS, & AWS services through an event-driven architecture.

    AppFlow

    Easy to implement, seamless data flow between SaaS applications and AWS services at any scale, without code.

    Budgets

    To track costs and usage in specific applications, budgets allow for precise control.

    License Manager

    License Manager makes it easier to manage software licenses from software vendors such as Microsoft, SAP, Oracle, & IBM across AWS & on-pre­mises enviro­nments.

    Provision

    CloudF­orm­ation

    CloudF­orm­ation enables the user to design & provision AWS infras­tru­cture deploy­ments predic­tably & repeat­edly.

    Service Catalog

    A service catalog provides a common interface for managing the lifecycle of AWS services and for securely provisioning, migrating to the latest version, deleting, and upgrading services. Service catalogs allow you to manage your AWS resources like a cloud Drujo - and maintain compliance with regulatory specifications.

    OpsWorks

    Creating and maintaining stacks and applications with OpsWorks is simple and flexible.

    Market­place

    In addition to thousands of independent software listings that can be found, tested, purchased, and deployed on AWS, Marketplace is a digital catalog with software listings from independent software vendors that make it easy to find, test, buy, and deploy software that runs on AWS.

    Operate

    CloudWatch

    CloudWatch can provide a dependable, scalable, & flexible monitoring solution that is simple to set up.

    CloudTrail

    It enables govern­ance, compli­ance, operat­ional auditing, & risk auditing of AWS accounts.

    Systems Manager

    it helps you manage your applications and infrastructure running in AWS

    Cost & usage report

    Refer to the cost management section. It has already been explained there.

    Cost explorer

    Refer to the cost management section. It has already been explained there.

    Managed Services

    It helps in Operating the AWS infras­tru­cture on our behalf.

    1- Run 1st Instance with aws console 
    2- Run 2nd instance with aws cli
    3- Create EFS filesystem 
    4- attach EFS to 1st and 2nd instance 
    5- mount in fstab and reboot instances

    Suppose an AWS service such as Amazon EC2 instance that runs your application, wants to make request to the AWS resources such as Amazon S3 bucket, the service must have security credentials to access the resources. If you embed security credentials directly into the instance, then distributing the credentials to the multiple instances create a security risk. To overcome such problems, you can create a role which is assigned to the Amazon EC2 instance that grants the permission to access the resources.

    Web-identity federation Suppose you are creating a mobile app that accesses AWS resources such as a game that run on a mobile device, but the information is stored using Amazon S3 and DynamoDB. When you create such an app, you need to make requests to the AWS services that must be signed with an AWS access key. However, it is recommended not to use long-term AWS credentials, not even in an encrypted form. An Application must request for the temporary security credentials which are dynamically created when needed by using web-identity federation. These temporary security credentials will map to a role that has the permissions needed for the app to perform a task. With web-identity federation, users do not require any custom sign-in code or user identities. A User can log in using the external identity provider such as login with Amazon, Facebook, Google or another OpenID. After login, the user gets the authentication token, and they exchange the authentication token for receiving the temporary security credentials.
  • The permissions are used by the third party to access the AWS resources. The permissions are associated with the role made when you define the trust policy. The policy defines the actions what they can take and what resources they can use.

  • ,
    D3en
    , and
    C6i
    .
    C5
    and
    C5d
    instances support VNNI for only
    12xlarge
    ,
    24xlarge
    , and
    metal
    instances.
    |
    r6id.metal
    |
    r7g.metal
    |
    u-6tb1.metal
    |
    u-9tb1.metal
    |
    u-12tb1.metal
    |
    u-18tb1.metal
    |
    u-24tb1.metal
    |
    x2gd.metal
    |
    x2idn.metal
    |
    x2iedn.metal
    |
    x2iezn.metal
    |
    z1d.metal

    M5dn

    m5dn.large | m5dn.xlarge | m5dn.2xlarge | m5dn.4xlarge | m5dn.8xlarge | m5dn.12xlarge | m5dn.16xlarge | m5dn.24xlarge | m5dn.metal

    M5n

    m5n.large | m5n.xlarge | m5n.2xlarge | m5n.4xlarge | m5n.8xlarge | m5n.12xlarge | m5n.16xlarge | m5n.24xlarge | m5n.metal

    M5zn

    m5zn.large | m5zn.xlarge | m5zn.2xlarge | m5zn.3xlarge | m5zn.6xlarge | m5zn.12xlarge | m5zn.metal

    M6a

    m6a.large | m6a.xlarge | m6a.2xlarge | m6a.4xlarge | m6a.8xlarge | m6a.12xlarge | m6a.16xlarge | m6a.24xlarge | m6a.32xlarge | m6a.48xlarge | m6a.metal

    M6g

    m6g.medium | m6g.large | m6g.xlarge | m6g.2xlarge | m6g.4xlarge | m6g.8xlarge | m6g.12xlarge | m6g.16xlarge | m6g.metal

    M6gd

    m6gd.medium | m6gd.large | m6gd.xlarge | m6gd.2xlarge | m6gd.4xlarge | m6gd.8xlarge | m6gd.12xlarge | m6gd.16xlarge | m6gd.metal

    M6i

    m6i.large | m6i.xlarge | m6i.2xlarge | m6i.4xlarge | m6i.8xlarge | m6i.12xlarge | m6i.16xlarge | m6i.24xlarge | m6i.32xlarge | m6i.metal

    M6id

    m6id.large | m6id.xlarge | m6id.2xlarge | m6id.4xlarge | m6id.8xlarge | m6id.12xlarge | m6id.16xlarge | m6id.24xlarge | m6id.32xlarge | m6id.metal

    M6idn

    m6idn.large | m6idn.xlarge | m6idn.2xlarge | m6idn.4xlarge | m6idn.8xlarge | m6idn.12xlarge | m6idn.16xlarge | m6idn.24xlarge | m6idn.32xlarge | m6idn.metal

    M6in

    m6in.large | m6in.xlarge | m6in.2xlarge | m6in.4xlarge | m6in.8xlarge | m6in.12xlarge | m6in.16xlarge | m6in.24xlarge | m6in.32xlarge | m6in.metal

    M7g

    m7g.medium | m7g.large | m7g.xlarge | m7g.2xlarge | m7g.4xlarge | m7g.8xlarge | m7g.12xlarge | m7g.16xlarge | m7g.metal

    Mac1

    mac1.metal

    Mac2

    mac2.metal

    T2

    t2.nano | t2.micro | t2.small | t2.medium | t2.large | t2.xlarge | t2.2xlarge

    T3

    t3.nano | t3.micro | t3.small | t3.medium | t3.large | t3.xlarge | t3.2xlarge

    T3a

    t3a.nano | t3a.micro | t3a.small | t3a.medium | t3a.large | t3a.xlarge | t3a.2xlarge

    T4g

    t4g.nano | t4g.micro | t4g.small | t4g.medium | t4g.large | t4g.xlarge | t4g.2xlarge

    C5n

    c5n.large | c5n.xlarge | c5n.2xlarge | c5n.4xlarge | c5n.9xlarge | c5n.18xlarge | c5n.metal

    C6a

    c6a.large | c6a.xlarge | c6a.2xlarge | c6a.4xlarge | c6a.8xlarge | c6a.12xlarge | c6a.16xlarge | c6a.24xlarge | c6a.32xlarge | c6a.48xlarge | c6a.metal

    C6g

    c6g.medium | c6g.large | c6g.xlarge | c6g.2xlarge | c6g.4xlarge | c6g.8xlarge | c6g.12xlarge | c6g.16xlarge | c6g.metal

    C6gd

    c6gd.medium | c6gd.large | c6gd.xlarge | c6gd.2xlarge | c6gd.4xlarge | c6gd.8xlarge | c6gd.12xlarge | c6gd.16xlarge | c6gd.metal

    C6gn

    c6gn.medium | c6gn.large | c6gn.xlarge | c6gn.2xlarge | c6gn.4xlarge | c6gn.8xlarge | c6gn.12xlarge | c6gn.16xlarge

    C6i

    c6i.large | c6i.xlarge | c6i.2xlarge | c6i.4xlarge | c6i.8xlarge | c6i.12xlarge | c6i.16xlarge | c6i.24xlarge | c6i.32xlarge | c6i.metal

    C6id

    c6id.large | c6id.xlarge | c6id.2xlarge | c6id.4xlarge | c6id.8xlarge | c6id.12xlarge | c6id.16xlarge | c6id.24xlarge | c6id.32xlarge | c6id.metal

    C6in

    c6in.large | c6in.xlarge | c6in.2xlarge | c6in.4xlarge | c6in.8xlarge | c6in.12xlarge | c6in.16xlarge | c6in.24xlarge | c6in.32xlarge | c6in.metal

    C7g

    c7g.medium | c7g.large | c7g.xlarge | c7g.2xlarge | c7g.4xlarge | c7g.8xlarge | c7g.12xlarge | c7g.16xlarge | c7g.metal

    CC2

    cc2.8xlarge

    Hpc6a

    hpc6a.48xlarge

    R5ad

    r5ad.large | r5ad.xlarge | r5ad.2xlarge | r5ad.4xlarge | r5ad.8xlarge | r5ad.12xlarge | r5ad.16xlarge | r5ad.24xlarge

    R5b

    r5b.large | r5b.xlarge | r5b.2xlarge | r5b.4xlarge | r5b.8xlarge | r5b.12xlarge | r5b.16xlarge | r5b.24xlarge | r5b.metal

    R5d

    r5d.large | r5d.xlarge | r5d.2xlarge | r5d.4xlarge | r5d.8xlarge | r5d.12xlarge | r5d.16xlarge | r5d.24xlarge | r5d.metal

    R5dn

    r5dn.large | r5dn.xlarge | r5dn.2xlarge | r5dn.4xlarge | r5dn.8xlarge | r5dn.12xlarge | r5dn.16xlarge | r5dn.24xlarge | r5dn.metal

    R5n

    r5n.large | r5n.xlarge | r5n.2xlarge | r5n.4xlarge | r5n.8xlarge | r5n.12xlarge | r5n.16xlarge | r5n.24xlarge | r5n.metal

    R6a

    r6a.large | r6a.xlarge | r6a.2xlarge | r6a.4xlarge | r6a.8xlarge | r6a.12xlarge | r6a.16xlarge | r6a.24xlarge | r6a.32xlarge | r6a.48xlarge | r6a.metal

    R6g

    r6g.medium | r6g.large | r6g.xlarge | r6g.2xlarge | r6g.4xlarge | r6g.8xlarge | r6g.12xlarge | r6g.16xlarge | r6g.metal

    R6gd

    r6gd.medium | r6gd.large | r6gd.xlarge | r6gd.2xlarge | r6gd.4xlarge | r6gd.8xlarge | r6gd.12xlarge | r6gd.16xlarge | r6gd.metal

    R6i

    r6i.large | r6i.xlarge | r6i.2xlarge | r6i.4xlarge | r6i.8xlarge | r6i.12xlarge | r6i.16xlarge | r6i.24xlarge | r6i.32xlarge | r6i.metal

    R6idn

    r6idn.large | r6idn.xlarge | r6idn.2xlarge | r6idn.4xlarge | r6idn.8xlarge | r6idn.12xlarge | r6idn.16xlarge | r6idn.24xlarge | r6idn.32xlarge | r6idn.metal

    R6in

    r6in.large | r6in.xlarge | r6in.2xlarge | r6in.4xlarge | r6in.8xlarge | r6in.12xlarge | r6in.16xlarge | r6in.24xlarge | r6in.32xlarge | r6in.metal

    R6id

    r6id.large | r6id.xlarge | r6id.2xlarge | r6id.4xlarge | r6id.8xlarge | r6id.12xlarge | r6id.16xlarge | r6id.24xlarge | r6id.32xlarge | r6id.metal

    R7g

    r7g.medium | r7g.large | r7g.xlarge | r7g.2xlarge | r7g.4xlarge | r7g.8xlarge | r7g.12xlarge | r7g.16xlarge | r7g.metal

    U-3tb1

    u-3tb1.56xlarge

    U-6tb1

    u-6tb1.56xlarge | u-6tb1.112xlarge | u-6tb1.metal

    U-9tb1

    u-9tb1.112xlarge | u-9tb1.metal

    U-12tb1

    u-12tb1.112xlarge | u-12tb1.metal

    U-18tb1

    u-18tb1.metal

    U-24tb1

    u-24tb1.metal

    X1

    x1.16xlarge | x1.32xlarge

    X2gd

    x2gd.medium | x2gd.large | x2gd.xlarge | x2gd.2xlarge | x2gd.4xlarge | x2gd.8xlarge | x2gd.12xlarge | x2gd.16xlarge | x2gd.metal

    X2idn

    x2idn.16xlarge | x2idn.24xlarge | x2idn.32xlarge | x2idn.metal

    X2iedn

    x2iedn.xlarge | x2iedn.2xlarge | x2iedn.4xlarge | x2iedn.8xlarge | x2iedn.16xlarge | x2iedn.24xlarge | x2iedn.32xlarge | x2iedn.metal

    X2iezn

    x2iezn.2xlarge | x2iezn.4xlarge | x2iezn.6xlarge | x2iezn.8xlarge | x2iezn.12xlarge | x2iezn.metal

    X1e

    x1e.xlarge | x1e.2xlarge | x1e.4xlarge | x1e.8xlarge | x1e.16xlarge | x1e.32xlarge

    z1d

    z1d.large | z1d.xlarge | z1d.2xlarge | z1d.3xlarge | z1d.6xlarge | z1d.12xlarge | z1d.metal

    I3

    i3.large | i3.xlarge | i3.2xlarge | i3.4xlarge | i3.8xlarge | i3.16xlarge | i3.metal

    I3en

    i3en.large | i3en.xlarge | i3en.2xlarge | i3en.3xlarge | i3en.6xlarge | i3en.12xlarge | i3en.24xlarge | i3en.metal

    I4i

    i4i.large | i4i.xlarge | i4i.2xlarge | i4i.4xlarge | i4i.8xlarge | i4i.16xlarge | i4i.32xlarge | i4i.metal

    Im4gn

    im4gn.large | im4gn.xlarge | im4gn.2xlarge | im4gn.4xlarge | im4gn.8xlarge | im4gn.16xlarge

    Is4gen

    is4gen.medium | is4gen.large | is4gen.xlarge | is4gen.2xlarge | is4gen.4xlarge | is4gen.8xlarge

    G5

    g5.xlarge | g5.2xlarge | g5.4xlarge | g5.8xlarge | g5.12xlarge | g5.16xlarge | g5.24xlarge | g5.48xlarge

    G5g

    g5g.xlarge | g5g.2xlarge | g5g.4xlarge | g5g.8xlarge | g5g.16xlarge | g5g.metal

    Inf1

    inf1.xlarge | inf1.2xlarge | inf1.6xlarge | inf1.24xlarge

    Inf2

    inf2.xlarge | inf2.8xlarge | inf2.24xlarge | inf2.48xlarge

    P2

    p2.xlarge | p2.8xlarge | p2.16xlarge

    P3

    p3.2xlarge | p3.8xlarge | p3.16xlarge

    P3dn

    p3dn.24xlarge

    P4d

    p4d.24xlarge

    P4de

    p4de.24xlarge

    Trn1

    trn1.2xlarge | trn1.32xlarge

    Trn1n

    trn1n.32xlarge

    VT1

    vt1.3xlarge | vt1.6xlarge | vt1.24xlarge

    M1

    m1.small | m1.medium | m1.large | m1.xlarge

    M2

    m2.xlarge | m2.2xlarge | m2.4xlarge

    M3

    m3.medium | m3.large | m3.xlarge | m3.2xlarge

    R3

    r3.large | r3.xlarge | r3.2xlarge | r3.4xlarge | r3.8xlarge

    T1

    t1.micro

    Yes

    Yes

    No

    Yes

    ENA

    M5a

    Yes

    Yes

    No

    Yes

    ENA

    M5ad

    No

    Yes

    NVMe

    Yes

    ENA

    M5d

    No

    Yes

    NVMe

    Yes

    ENA

    M5dn

    No

    Yes

    NVMe

    Yes

    ENA | EFA

    M5n

    Yes

    Yes

    No

    Yes

    ENA | EFA

    M5zn

    Yes

    Yes

    No

    Yes

    ENA | EFA

    M6a

    Yes

    Yes

    No

    Yes

    ENA | EFA

    M6g

    Yes

    Yes

    No

    Yes

    ENA

    M6gd

    No

    Yes

    NVMe

    Yes

    ENA

    M6i

    Yes

    Yes

    No

    Yes

    ENA | EFA

    M6id

    No

    Yes

    NVMe

    Yes

    ENA | EFA

    M6idn

    No

    Yes

    NVMe

    Yes

    ENA | EFA

    M6in

    Yes

    Yes

    No

    Yes

    ENA | EFA

    M7g

    Yes

    Yes

    No

    Yes

    ENA | EFA

    Mac1

    Yes

    Yes

    No

    Yes

    ENA

    Mac2

    Yes

    Yes

    No

    Yes

    ENA

    T2

    Yes

    No

    No

    Yes

    Not supported

    T3

    Yes

    Yes

    No

    Yes

    ENA

    T3a

    Yes

    Yes

    No

    Yes

    ENA

    T4g

    Yes

    Yes

    No

    Yes

    ENA

    Yes

    Yes

    No

    Yes

    ENA

    C5a

    Yes

    Yes

    No

    Yes

    ENA

    C5ad

    No

    Yes

    NVMe

    Yes

    ENA

    C5d

    No

    Yes

    NVMe

    Yes

    ENA

    C5n

    Yes

    Yes

    No

    Yes

    ENA | EFA

    C6a

    Yes

    Yes

    No

    Yes

    ENA | EFA

    C6g

    Yes

    Yes

    No

    Yes

    ENA

    C6gd

    No

    Yes

    NVMe

    Yes

    ENA

    C6gn

    Yes

    Yes

    No

    Yes

    ENA | EFA

    C6i

    Yes

    Yes

    No

    Yes

    ENA | EFA

    C6id

    No

    Yes

    NVMe

    Yes

    ENA | EFA

    C6in

    Yes

    Yes

    No

    Yes

    ENA | EFA

    C7g

    Yes

    Yes

    No

    Yes

    ENA | EFA

    CC2

    No

    No

    HDD

    Yes

    Not supported

    Hpc6a

    Yes

    Yes

    No

    Yes

    ENA | EFA

    No

    Yes

    NVMe

    Yes

    ENA | EFA

    R4

    Yes

    No

    No

    Yes

    ENA

    R5

    Yes

    Yes

    No

    Yes

    ENA

    R5a

    Yes

    Yes

    No

    Yes

    ENA

    R5ad

    No

    Yes

    NVMe

    Yes

    ENA

    R5b

    Yes

    Yes

    No

    Yes

    ENA

    R5d

    No

    Yes

    NVMe

    Yes

    ENA

    R5dn

    No

    Yes

    NVMe

    Yes

    ENA | EFA

    R5n

    Yes

    Yes

    No

    Yes

    ENA | EFA

    R6a

    Yes

    Yes

    No

    Yes

    ENA | EFA

    R6g

    Yes

    Yes

    No

    Yes

    ENA

    R6gd

    No

    Yes

    NVMe

    Yes

    ENA

    R6i

    Yes

    Yes

    No

    Yes

    ENA | EFA

    R6idn

    No

    Yes

    NVMe

    Yes

    ENA | EFA

    R6in

    Yes

    Yes

    No

    Yes

    ENA | EFA

    R6id

    No

    Yes

    NVMe

    Yes

    ENA | EFA

    R7g

    Yes

    Yes

    No

    Yes

    ENA | EFA

    U-3tb1

    Yes

    Yes

    No

    Yes

    ENA

    U-6tb1

    Yes

    Yes

    No

    Yes

    ENA

    U-9tb1

    Yes

    Yes

    No

    Yes

    ENA

    U-12tb1

    Yes

    Yes

    No

    Yes

    ENA

    U-18tb1

    Yes

    Yes

    No

    Yes

    ENA

    U-24tb1

    Yes

    Yes

    No

    Yes

    ENA

    X1

    No

    No

    SSD

    Yes

    ENA

    X2gd

    No

    Yes

    NVMe

    Yes

    ENA

    X2idn

    No

    Yes

    NVMe

    Yes

    ENA | EFA

    X2iedn

    No

    Yes

    NVMe

    Yes

    ENA | EFA

    X2iezn

    Yes

    Yes

    No

    Yes

    ENA | EFA

    X1e

    No

    No

    SSD

    Yes

    ENA

    z1d

    No

    Yes

    NVMe

    Yes

    ENA

    No

    Yes

    NVMe

    Yes

    ENA

    D3en

    No

    Yes

    NVMe

    Yes

    ENA

    H1

    No

    No

    HDD

    Yes

    ENA

    HS1

    No

    Yes

    HDD

    Yes

    Not supported

    I3

    No

    Yes

    NVMe

    Yes

    ENA

    I3en

    No

    Yes

    NVMe

    Yes

    ENA | EFA

    I4i

    No

    Yes

    NVMe

    Yes

    ENA | EFA

    Im4gn

    No

    Yes

    NVMe

    Yes

    ENA | EFA

    Is4gen

    No

    Yes

    NVMe

    Yes

    ENA

    No

    Yes

    NVMe

    Yes

    Not supported

    G3

    Yes

    No

    No

    Yes

    ENA

    G4ad

    No

    Yes

    NVMe

    Yes

    ENA

    G4dn

    No

    Yes

    NVMe

    Yes

    ENA | EFA

    G5

    No

    Yes

    NVMe

    Yes

    ENA | EFA

    G5g

    Yes

    Yes

    No

    Yes

    ENA

    Inf1

    Yes

    Yes

    No

    Yes

    ENA | EFA

    Inf2

    Yes

    Yes

    No

    Yes

    ENA

    P2

    Yes

    No

    No

    Yes

    ENA

    P3

    Yes

    No

    No

    Yes

    ENA

    P3dn

    No

    Yes

    NVMe

    Yes

    ENA | EFA

    P4d

    No

    Yes

    NVMe

    Yes

    ENA | EFA

    P4de

    No

    Yes

    NVMe

    Yes

    ENA | EFA

    Trn1

    No

    Yes

    NVMe

    Yes

    ENA | EFA

    Trn1n

    No

    Yes

    NVMe

    Yes

    ENA | EFA

    VT1

    Yes

    Yes

    No

    Yes

    ENA | EFA

    No

    No

    HDD

    Yes

    Not supported

    C3

    No

    No

    SSD

    Yes

    Not supported

    G2

    No

    No

    SSD

    Yes

    Not supported

    I2

    No

    No

    SSD

    Yes

    Not supported

    M1

    No

    No

    HDD

    Yes

    Not supported

    M2

    No

    No

    HDD

    Yes

    Not supported

    M3

    No

    No

    SSD

    Yes

    Not supported

    R3

    No

    No

    SSD

    Yes

    Not supported

    T1

    Yes

    No

    No

    Yes

    Not supported

    Instances built on the Nitro Systemarrow-up-right
    Networking and storage featuresarrow-up-right
    Instance limitsarrow-up-right
    General purpose instancesarrow-up-right
    Compute optimized instancesarrow-up-right
    Memory optimized instancesarrow-up-right
    Storage optimized instancesarrow-up-right
    Linux accelerated computing instancesarrow-up-right
    Find an Amazon EC2 instance typearrow-up-right
    Get recommendations for an instance typearrow-up-right
    Change the instance typearrow-up-right
    Storage optimizedarrow-up-right
    Accelerated computingarrow-up-right
    AWS re:Inforce 2019: Security Benefits of the Nitro Architecturearrow-up-right
    Placement groupsarrow-up-right
    Enhanced networking on Linuxarrow-up-right
    Network maximum transmission unit (MTU) for your EC2 instancearrow-up-right
    Storage optimizedarrow-up-right
    Accelerated computingarrow-up-right
    Previous generation instance typesarrow-up-right

    It is suitable for the applications with short term, spiky or unpredictable workloads that cannot be interrupted.

  • It is useful for the applications that have been developed or tested on Amazon EC2 for the first time.

  • On Demand instance is recommended when you are not sure which instance type is required for your performance needs.

  • It is used for those applications that require reserved capacity.

  • Users can make up-front payments to reduce their total computing costs. For example, if you pay all your upfronts and you do 3 years contract, then only you can get a maximum discount, and if you do not pay all upfronts and do one year contract then you will not be able to get as much discount as you can get If you do 3 year contract and pay all the upfronts.

  • It is useful for those users who have an urgent need for large amounts of additional computing capacity.

  • EC2 Spot Instances provide less discounts as compared to On Demand prices.

  • Spot Instances are used to optimize your costs on the AWS cloud and scale your application's throughput up to 10X.

  • EC2 Spot Instances will continue to exist until you terminate these instances.

  • It can be purchased as a Reservation for up to 70% off On-Demand price.

    Enter the bucket name and then click on the Next button.
    Transition to Standard Infrequent Access storage class (after 30 days of creation date).
  • Transition to Glacier storage class (after 60 days of creation date).

  • It can also delete the objects permanently.

  • We can create an internet gateway and attach it to our VPC.
  • It provides much better security control over your AWS resources.

  • We can assign security groups to individual instances.

  • We also have subnet network access control lists (ACLS).

  • Peering is in a star configuration, i.e., 1 VPC peers other 4 VPCs.

  • It has no Transitive Peering!!.

  • Tighten security settings
    Make sure that your security group and network access control rules allow relevant traffic to flow in and out of your instance

    The rules of a security group can be modified at any time, and apply immediately

    Unlike security groups, ACLs are stateless; responses to allow inbound traffic is subject to the rules for outbound traffic.

    500 security groups per VPC
  • 50 inbound and outbound rules per VPC

  • IP addressarrow-up-right
    EC2arrow-up-right
    firewallarrow-up-right
    SQLarrow-up-right
    amazon-vpc
    aws-vpc
    vpc
    amazon-route-s3
    aws-vpc.
    custom-route-table
    NAT-gateway
    main route
    security-group
    database-servers
    network acl
    virtual-pvt-gtw
    inbound-outbound
    When AMI is no longer required, then you can also deregister it.
  • In EBS - backed instances, you will be charged or billed for the storage of static data such as operating systems files, etc.

  • The cost of adding the EBS Volume to an EC2 instance is minimal.

  • 1 TB

    10 - 16 TB

    AMI creation

    AMI is very easily created by using a single command.

    To create an AMI, it requires installation and AMI tools.

    Expensive

    It is less expensive.

    It is more expensive as compared to Instance Store-backed instance.

    Lifecycle

    It supports stopping as well as restarting of an instance by saving the state to EBS volume.

    In this case, an instance cannot be stopped. It can be either in a running or terminated state.

    Data Persistence

    Data persists in EBS volume. If an instance is terminated, no data would be lost.

    Data does not persist so when instance is terminated, data would be lost.

    Boot time

    It takes less than 1 min.

    It usually takes less than 5 min.

    Size limit

    It supports up to 4000 IOPS which is quite very high.
  • SSD storage is very high performing, but it is quite expensive as compared to HDD (Hard Disk Drive) storage.

  • SSD volume types are optimized for transactional workloads such as frequent read/write operations with small I/O size, where the performance attribute is IOPS.

  • It is used when you require more than 10,000 IOPS.

    It can support up to 100 IOPS which is very low.

    It is used for Big data, Data warehouses, Log processing, etc.

  • It cannot be a boot volume, so it contains some additional volume. For example, if we have Windows server installed in a C: drive, then C drive cannot be a Throughput Optimized Hard disk, D: drive or some other drive could be a Throughput Optimized Hard disk.

  • The size of the Throughput Hard disk can be 500 GiB to 16 TiB.

  • It supports up to 500 IOPS.

  • It is mainly used for a File server.
  • It cannot be a boot volume.

  • The size of the Cold Hard disk can be 500 GiB to 16 TiB.

  • It supports up to 250 IOPS.

  • Magnetic volume is the only hard disk which is bootable. Therefore, we can say that it can be used as a boot volume.

    Each domain name is registered in a central database known as the WhoIS database.

  • The popular domain registrars include GoDaddy.com, 123-reg.co.uk, etc.

  • The default number of records for the time-to-live file on resource records. For example, when you are dealing with a DNS, then it always has a time-to-live. Time-to-live must be lower as possible because when you make changes, it then propagates quicker. Suppose the name of the website is Hindi100.com and its time-to-live is 60 seconds. By the end, you want to change its IP address then the time taken to achieve this is equal to the time-to-live.
  • The number of seconds a secondary name server has to wait before checking for the updates.

  • The maximum number of seconds that a secondary name server can use the data before it is either be refreshed or expire.

  • contains a
    www
    infront of the domain name, therefore, it cannot be used for CNAME.

    The resolver obtains the authoritative name server for the domain—these will be four Amazon Route 53 name servers that host the domain’s DNS zone.

  • The DNS resolver chooses one of the four Route 53 servers and requests details for the hostname www.example.comarrow-up-right.

  • The Route 53 name server looks in the DNS zone for www.example.com, gets the IP address and other relevant information, and returns it to the DNS resolver.

  • The DNS resolver returns the IP address to the user’s web browser. The DNS resolver also caches the IP address locally as specified by the Time to Live (TTL) parameter.

  • The browser contacts the webserver or other Amazon-hosted services by using the IP address provided by the resolver.

  • The website is displayed on the user’s web browser.

  • Fast
  • Cost-effective

  • Designed to Integrate with Other AWS Services

  • Secure

  • Scalable

  • Limited Route 53 DNS load balancing: The features of AWS Route 53 load balancer lack advanced policy support and enterprise-class features and provide only basic load balancing capabilities.

  • Route 53 Cost: For businesses using Route 53 with non-AWS endpoints or services, the service is expensive. In particular, the visual editor is costly including the cost of each query.

  • No support for private zone transfers: AWS Route 53 DNS cannot be appointed as the authoritative source for cloud websites.com, even after having the root-level domain registered.

  • Latency: All AWS Route 53 queries must be forwarded to external servers after contacting Amazon infrastructure.

  • DNSMadeEasy: It offers affordable DNS management services that are easy to manage. It also has the highest uptime and amazing ROI.

  • DNSimple: With DNSimple, you can register a domain quickly with no upselling and hassles.

  • AWS Trainingarrow-up-right
    AWS ELBarrow-up-right
    Amazon EC2arrow-up-right
    Amazon S3.arrow-up-right
    azure services fabricarrow-up-right
    AWS IAMarrow-up-right
    CloudFrontarrow-up-right
    AWS Tutorialarrow-up-right
    VPCarrow-up-right
    AWS Management Consolearrow-up-right
    www.freenom.comarrow-up-right
    AWS Tools for Windows PowerShell – Provides commands for a broad set of AWS products for those who script in the PowerShell environment. To get started, see the AWS Tools for Windows PowerShell User Guidearrow-up-right. For more information, see the AWS Tools for PowerShell Cmdlet Referencearrow-up-right.
  • AWS SDKs – Provides language-specific API operations and takes care of many of the connection details, such as calculating signatures, handling request retries, and handling errors. For more information, see AWS SDKsarrow-up-right.

  • Query API – Provides low-level API actions that you call using HTTPS requests. Using the Query API is the most direct way to access AWS services. However, it requires your application to handle low-level details such as generating the hash to sign the request, and handling errors. For more information, see the Amazon EC2 Auto Scaling API Referencearrow-up-right.

  • AWS CloudFormation – Supports creating Auto Scaling groups using CloudFormation templates. For more information, see Create Auto Scaling groups with AWS CloudFormationarrow-up-right.

  • Groups

    Your EC2 instances are organized into groups so that they can be treated as a logical unit for the purposes of scaling and management. When you create a group, you can specify its minimum, maximum, and, desired number of EC2 instances. For more information, see Auto Scaling groupsarrow-up-right.

    Configuration templates

    Your group uses a launch template, or a launch configuration (not recommended, offers fewer features), as a configuration template for its EC2 instances. You can specify information such as the AMI ID, instance type, key pair, security groups, and block device mapping for your instances. For more information, see Launch templatesarrow-up-right and Launch configurationsarrow-up-right.

    Scaling options

    Amazon EC2 Auto Scaling provides several ways for you to scale your Auto Scaling groups. For example, you can configure a group to scale based on the occurrence of specified conditions (dynamic scaling) or on a schedule. For more information, see Scaling optionsarrow-up-right.

    Get started with Amazon EC2 Auto Scalingarrow-up-right
    Use Elastic Load Balancing to distribute traffic across the instances in your Auto Scaling grouparrow-up-right
    Monitor CloudWatch metrics for your Auto Scaling groups and instancesarrow-up-right
    Application Auto Scaling User Guidearrow-up-right
    Prepare to use the AWS CLIarrow-up-right
    autoscalingarrow-up-right
    hashtag
    Application Load Balancer
    • An Amazon Web Services (AWS) launched a new load balancer known as an Application load balancer (ALB) on August 11, 2016.

    • It is used to direct user traffic to the public AWS cloud.

    • It identifies the incoming traffic and forwards it to the right resources. For example, if a URL has /API extensions, then it is routed to the appropriate application resources.

    • It is operated at Layer 7 of the OSI Model.

    • It is best suited for load balancing of HTTP and HTTPs traffic.

    • Application load balancers are intelligent, sending specific requests to specific web servers.

    • If we take an example of TESLA. We have three models of TESLA, i.e., TESLA Model X, TESLA Model S, and TESLA Model 3 and TESLAs have onboard computing facility. You will have a group of web servers that serve the Model X, a group of web servers that serve the Model S, and similarly for Model 3. We have one Load balance that checks whether the incoming traffic comes from either Model X, Model S or Model 3, and then sends it to the intended froup of servers.

    hashtag
    Network Load Balancer

    • It is operated at the Layer 4 of the OSI model.

    • It makes routing decisions at the transport layer (TCP/SSL), and it can handle millions of requests per second.

    • When a load balancer receives a connection, it then selects a target from the target group by using a flow hash routing algorithm. It opens the TCP connection to the selected target of the port and forwards the request without modifying the headers.

    • It is best suited for load balancing the TCP traffic when high performance is required.

    AD

    hashtag
    Classic Load Balancer

    • It is operated at Layer 4 of the OSI model.

    • It routes the traffic between clients and backend servers based on IP address.

    • For example, an Elastic Load balancer receives a request from a client on TCP port 80, it will then routes the request to a specified port of backend servers. The port on which the Load Balancer routes to the target server will be having port number 80. The backend server will then send the requested data back to the ELB, which will then forward the Backend server reply to the client. According to the client's perspective, the request has been fulfilled by the ELB, not by the backend server.

    • Classic Load balancers are legacy Elastic load balancers.

    • It can also be used for load balancing the HTTP or HTTPs traffic and use layer 7-specific features, such as X-forwarded and sticky sessions.

    • You can also use the Layer 4 load balancing for applications that rely purely on the TCP protocol.


    AD

    hashtag
    Load Balancer Errors

    • Classic Load Balancer

    If you get an error 504, this is a gateway timeout error. A Load balancer is still available, but it has a problem in communicating with the EC2 instance. If your application stops responding, the ELB (Classic Load Balancer) responds with a 504 error. This means that the application is having issues and it could be either at the web server layer or the Database layer.

    In order to troubleshoot where the application is failing, and scale it up or out where possible.

    X-Forwarded-For-Header

    The X-Forwarded-For-Header is used to determine the IP address of a client when you use a classic load balancer.

    Working of X-Forwarded-For-Header

    • A user is on the Ipv4 address, i.e., 124.12.3.23.

    • A user is sending a request to the classic load balancer which in turn folded the request into an EC2 instance. An EC2 instance is going to use the private address, i.e., 10.0.0.23 and this is the only address which is seen by an EC2 instance.

    • An EC2 instance is capturing only private address as Classis Load balancer encompasses the Public IP address. The public address is needed as it provides valuable information such as "who are using your website".

    • An EC2 instance gets the Ipv4 address in the form of X-Forwarded-For request Header from the Classic load balancer.

    Zinadarrow-up-right
    Enhanced Networkingarrow-up-right

    Fawry cloud devops internship

    circle-check

    Fawry cloud devops internship:

    Start Date : 15 Oct 2023

    End Date : 8 Nov 2023

    Location : Working Days from office : Monday , Wednesday

    hashtag
    Day 1: Introduction to AWS

    1. Introduction to AWS (1 hour)

      • Overview of AWS services and benefits

      • AWS Global Infrastructure

    hashtag
    Day 2: Storage and RDS

    1. AWS Storage Services (2 hours)

      • Amazon S3: Object storage

      • Amazon EBS: Block storage

    hashtag
    Day 3: VPC and Network

    1. AWS Networking and Content Delivery (2 hours)

      • Amazon VPC: Virtual private cloud

      • Amazon Route 53: DNS service

    hashtag
    Day 4: CI/CD and Monitoring

    1. AWS Management and Monitoring (2 hours)

      • AWS CloudFormation: Infrastructure as code

      • AWS CloudWatch: Monitoring and logging

    hashtag
    Day 5: AWS Serverless and AI

    1. AWS Serverless Architecture (2 hours)

      • AWS Lambda: Event-driven serverless functions

      • Amazon API Gateway: Building RESTful APIs

    hashtag
    Day 6 : AWS EKS

    1. Introduction to AWS EKS and Fargate (1 hour)

      • Overview of AWS Elastic Kubernetes Service (EKS)

      • Introduction to AWS Fargate

    hashtag
    Day 7 : AWS Fargate

    1. Introduction to AWS Fargate (1 hour)

      • Overview of AWS Fargate and its role in serverless container management

      • Use cases and benefits of using Fargate

    hashtag
    Day 8: Managing EKS and Fargate

    1. Managing and Scaling EKS and Fargate (2 hours)

      • Scaling EKS worker nodes

      • Scaling Fargate tasks and clusters

    User Guide

    hashtag
    Login

    There is no public section in the ZiSoft Security Awareness Application. Any user wishing to perform any kind of operation on the system will have to login first.

    Zinad Logo

    The system comes with two predefined users

    1. Administrator whose username is “admin” and default password is “Admin123@”

    2. Normal User whose username is “user” and password is “User123@”

    It is extremely important to change the password of your admin user once you have installed the application. To do so...

    1. login with the default admin username and password,

    2. then go to the “Administrator” drop down on the top bar

    3. navigate to “settings” => users

    hashtag
    Initial Configuration

    The first thing you need to do after installing the system is to head to the “settings” area and add your organization information. This is a system-wide information that will be used throughout the application.

    To change your settings...

    1. navigate to "Administration" => "Settings"

    2. click on “Edit” then set your application URL and Company name. Make sure to include the protocol and the fully qualified domain name in the Host field. This has to be the same URL from which you are serving your awareness application. For example: Host Name should be . Example of company name is ”Big Company”.

    3. click save and wait for the confirmation message

    hashtag
    Manually Adding Users

    Zisoft allows you to add users either manually or by importing them from a CSV file or by integration with LDAP. To add users manually,

    1. navigate to the "Administrator" => "Settings" => "Users" page

    2. Click on "+ User"

    3. Enter the user details and click "Save"

    Note that you need to choose the types of newly added user. Users can be of one of the following types

    • Administrator: This is a user with full access to the system. This user can create and manage campaigns and other users, send emails, view reports and so on.

    • Moderator: This is a user with the same authorities as Administrator, However, this user can't see the campaigns created by any Administrator or any other Moderator. Moderators also don't have access to some system settings like LDAP servers or Email server.

    • User: This is the normal user who can only view lessons and complete exams*

    hashtag
    Resetting a Password for Another User

    As an Administrator, you can reset the password of any other non-admin user. To do so...

    1. navigate to the users page

    2. click on "password" next to the respective user

    3. set the password twice, then click save

    hashtag
    Email Server Settings

    An email server is used when ever you are sending emails from the Awareness system. You can configure one server for every kind of emails or a separate server for each kind.

    The "Awareness" system sends the following kinds of Emails

    • Training: This is an email you send in the context of a specific training campaign. For example, an email saying "Dear user, you have been invited to a campaign 'Q1'", and so on. More on this later in this guide

    • Phishing: This is an email you send to your users to verify their vulnerability to phishing emails, something like an attack simulator. More on this later in this guide.

    • Tips: This is an email you send to your users to advise them on best security practices and behaviors. For example "Make sure to remember to lock your PC before you leave the office". You can send tips everyday, every week, every month, or so on.

    To configure a server...

    1. navigate to "Administrator" => "Emails" => "Email Servers"

    2. click on "+ Email Server"

    3. add all server information like host, port, and authentication methods

    Note that, like any other password in "Awareness", there is a separate action for setting this password. To set email password ...

    1. click on "Password" next tot the respective email server

    2. enter the password twice

    3. click "Save"

    hashtag
    Importing Users from LDAP

    Awareness can import your LDAP users automatically, but you will need to configure an LDAP server first. To do so...

    1. Navigate to "Administrator" => "Settings" => "LDAP Servers"

    2. Click on "+ LDAP Server"

    3. Enter all the server information

    To set the password of the LDAP server, there is a separate action for it

    1. Click on "Password" of the respective server

    2. Enter the password

    3. Click save

    Once a server is configured, you will need to click on "Import" to pull all the users from the LDAP server and create respective users for them in the system

    Note: Clicking on "Import" does not import users immediately. This action spawns a background process called "Job" that will do the actual importing. You will see that the number of users on the system starts to increase gradually until all users are imported. You can check background job status in the "Administrator" => "Settings" => "Background Jobs" page

    Also note that any user imported will LDAP will automatically by assigned role "User" not "Administrator". An existing administrator will need to change a specific user role to "Administrator" if they wish to give them that privilege.

    hashtag
    Training Campaign

    A campaign is like a course or a semester. You start a campaign when you have some lessons that you need to distribute to your users. The campaign holds information about the lessons, the users, start date, end date, exams, and so on.

    To create a campaign...

    1. Navigate to "Administrator" => "Training" => "Training Campaigns".

    2. Click "+ Campaign"

    3. Enter the campaign information

    Note that the choice of having an exam in the campaign is final and can not be changed once the campaign has been created. This is because changing the exam will result in wrong values in the reports because some of your users might have already submitted the old exams that you have changed. More on exams later

    Now, you need to add lessons to the campaign

    1. Click on "Lessons" next to the desired campaign

    2. From the menu, select all applicable Lessons

    3. Click Save

    Once the campaign has lessons, it is time to add users to it.

    1. Click on "Users" next to the desired Campaign

    2. Select all applicable users

    3. Click "Save"

    Your campaign is now ready. Any user who signs into the "Awareness" system will be able to see that they are required to complete those lessons (and possibly an exam if you configured one) in order to pass the campaign.

    hashtag
    Exams

    An exam is a collection of questions from different lessons. You can have an exam with one question from every lesson or an exam with two questions from a each lesson related to passwords or any combination of questions you like. The questions in the exam has no direct relation with the lessons of the training campaigns. This means that it is up to you to make sure your exam does not include questions that has not been covered in the campaign.

    Exams can also be used without any training lessons. For example, you may wish to start a training campaign with only an exam and no lessons at the beginning of your awareness initiative to measure your employees' security awareness and tailor the upcoming training campaigns accordingly.

    To create a new exam and use it in a campaign...

    1. Navigate to "Administrator" => "Training" => "Exams"

    2. Click on "+ Exam"

    3. Enter the name of your Exam

    Now that you created the empty exam, you should be able to add lessons to it.

    1. Next to the exam that you just created, click on "Lessons"

    2. Click on "+ Lesson" in the sub area

    3. Choose the lessons that you want to add to the Exam

    With the Exam ready, you can now navigate to "Training Campaigns" and chose this exam when creating a new campaign.

    Note: Exams are final; you can add an exam to a new campaign, but you can not change it or remove it from a campaign once it is added.

    hashtag
    Custom Lessons, Quizzes and Exams

    ZiSoft Awareness comes with a rich set of predefined questions and answers, but sometimes you might want to create your own questions. Not only that, you can even define a new lesosn altogether, for your compliance training for example. To create your own questions in an existing lesson...

    1. Navigate to "Administrator" => "Training" => "Lesson"

    2. Open the desired lesson, then click on "Questions"

    3. Click no "+ Add Question"

    To create your own lesson first, click on "+ Lesson" first, name the lesson, then follow the same steps above.

    hashtag
    Sending Emails to Campaign Users

    Normally, you would need to send a notification email to all users in a given campaign to tell them that they have been enrolled in the campaign and need to start completing the lessons. To do so, we will use the "Email Engine".

    "Awareness" system sends a variety of emails. Sending emails is done also in campaigns. An email campaign is different from a training campaign, but serves the same purpose. It gathers the information needed to send an email to a target set of users.

    1. Navigate to "Administrator" => "Email" => "Email Campaign"

    2. Click on "+ Email Campaign", enter a name for the email campaign, then click "Save"

    3. Click on "Send" next to the campaign that you just created

    Note: like importing users from LDAP, sending emails is a lengthy operation. Imagine sending to ten thousand users. For this reason, clicking on "Send" does not actually send the emails. Instead, it creates a background process (called Job) that does the actual sending. You can check background job status in the "Administrator" => "Settings" => "Job" page

    "Awareness" comes bundled with a set of email templates that you can use, or you can build your own template adding your own logo and signatures and so on. See "Adding Email Templates"

    hashtag
    Including Files in Emails

    Admins can add links in the email templates. Links can point to files in an external storage on the internet, an internal storage in your origanization, or inside the awareness system server itself. See "Adding Email Templates" below.

    NOTE: ZiSoft does not currently support attaching files inside the emails themselves. All files, images, logos, etc., must be included via links.

    hashtag
    Attending Lessons

    Once you received the campaign notification email, you should be able to view the lessons in this campaign by visiting the home page of the Awareness System e.g (or if you have a cloud deployment). The home page will list all campaigns that you are added to in chronological order.

    Each campaign listing will show how many lessons you have completed and how many lessons you have remaining to be completed. If the admin has added an exam, you will see the status of the exam and your score if you have passed. Click on each lesson to go to the classroom page to attend the lesson and complete its quiz.

    If you are a non admin user, this is the only thing you will need to do on the awareness system.

    hashtag
    Adding Email Templates

    1. Navigate to "Administrator" => "Email" => "Templates"

    2. Click on "+ Email Template"

    3. Enter the template name, content, and so on

    Emails are sent in contexts. For example, "Training", "Phishing", "News", etc. Choosing the right context allows the email engine to process template place holders correctly.

    hashtag
    Template Placeholders

    Embedded inside template content, you can find texts similar to {first_name}, {last_name}, {campaign_name}, etc. These are called "place holders". Placeholders are special texts that get replaced by the email engine at the time of sending the email.

    For example, if you have a template that reads...

    the end user will receive an email that reads...

    The list of available email template place holders is

    • {first_name}: First name of the receiver

    • {last_name}: Last name of the receiver

    • {username}: Username of the receiver

    More tags will be added in upcoming releases

    hashtag
    Phishing

    Conducting a phishing campaign requires coordination between several parts of the application

    First, you need to create a container that serves as a record of this campaign. This is called the "Phishpot" or the "Phishing Campaign". Each phishing campaign designates one "Phishing Page". The phishing page is a web page that will be the target of the emails sent to the users. In other words, when your users click on the phishing email, this is the page they will be taken to. The Awareness system comes pre packaged with a set of phishing pages to use, and you can define and use your own if you want.

    Second, you need to send the email. A phishing email is just a regular email sent like any other email, but with one small difference: it contains a special tracking code similar to "". This link is specific to each user and helps the system track which of the users have fallen victim for this phishing campaign and which haven't. The Awareness system also comes packed with phishing emails that you can use out of the box, and you can define your own if you want.

    The following section describe how to configure campaigns, emails and pages.

    hashtag
    Phishing Campaign

    To create a new phishing campaign ...

    1. Navigate to "Administrator" => Phishing => Phishing campaigns

    2. Click on "+ Phishing Campaign"

    3. Enter the name of the campaign

    Now that the campaign is created, you need to add users to it

    1. Click on "Users" next to the campaign you want

    2. A sub area will open. Click on "+ Add User"

    3. Select the users you want to add to the campaign

    hashtag
    Phishing Email Templates

    The Awareness system comes pre-packaged with phishing email templates. You can use those templates out of the box. If you you need to define your own, you need to create your own phishing email template. To add a phishing email template is similar to adding any email template but you choose the type of the email to be "Phishing". Within the email body, you need to insert a link that directs to "{host}/execute/page/{link}". Before sending the email, the engine will replace the two special tags {host} and {link} with the host you entered in your settings and the special link that is specific to each user as described in "Phishing" section above

    hashtag
    Phishing Pages

    The system comes pre-packaged with phishing pages. To add a phishing page of your own ...

    1. Navigate to "Administration" => "Phishing" => "Phishing Pages"

    2. Click on "+ Phishing Page"

    3. Enter the name of the page and the content

    Example "Out of The Box" Phishing Pages

    LinkedIn Phishing Page

    Office 365 Phishing Page

    hashtag
    Sending Phishing Emails

    To send phishing emails, you need to setup some pre-requisites, namely "Email Server" and DNS Name.

    1. Email Server: You need to setup an email server with an email account that will be used to send the phishing emails. The name of this account should be related to the phishing campaign. For example, if your company is called "Company-Inc" and you are using the "Linked In" phishing campaign, then your should create a user called "".

    2. DNS Name: When your users click on the phishing emails in the links, they will be redirected to a phishing page. If this page's name is called "awareness.company-inc.com", the users might be aware they are being tested. Instead, the page should be named something like "linkedin.company-inc.com"

    In the Cloud deployment, ZiSoft can provide an account like "" and can provide a DNS like "". If you need more control, you will need to setup your own domain name and email server.

    When you have the above pre-requisites, you can use the Email Campaign tool as described above.

    hashtag
    Reporting

    ZiSoft Awareness uses a very powerful reporting engine called . MetaBase allows you to run very specific and customized queries against your ZiSoft Awareness instance. For example, you can create a question asking "What is the percentage of people who passed campaign 'Q1'" or "What is the progress in the percentage of success between last campaign and this campaign". After asking your question, you can organize those questions in "Dashboards". This dashboard is "Live" meaning that it will find the most recent information in the database and present it to you whenever you refresh the page. This dashboard can be saved and loaded anytime.

    ZiSoft Awareness comes with example dashboards that contain some example questions about training campaigns and phishing campaigns. You can customize it or you can copy paste from it to build your own campaign. If you would like help with that, talk to .

    hashtag
    Viewing Dashboards

    To view the dashboards...

    1. click on your user-name on the top-right corner of the screen

    2. click on Admin Dashboards

    3. Choose the dashboard from the drop down

    hashtag
    Editing or Adding Dashboards

    Dashboards are edited in the MetaBase interface. To login in to MetaBase, click on "Analytics" in the Administrator drop down menu

    The username/password of the MetaBase administrator is different from the ZiSoft Awareness administrator. Use admin@example.com and Admin123@ to login. You can change them once you are inside MetaBase UI.

    Laravel Deployment Architecture

    A deployment architecture depicts the mapping of a logical architecture to a physical environment. The physical environment includes the computing nodes in an intranet or Internet environment, CPUs, memory, storage devices, and other hardware and network devices.

    Designing the deployment architecture involves sizing the deployment to determine the physical resources necessary to meet the system requirements specified during the technical requirements phase. You also optimize resources by analyzing the results of sizing the deployment to create a design that provides the best use of resources within business constraints.

    hashtag

    1. SeMA application sizing-estimation process .

    2. Deployment Logical Architecture .

    3. HW Sizing Specs .

    4. Deployment Process .

    hashtag

    hashtag
    Phishing simulations

    Beside introducing real-world customizable phishing simulations, Entrench offers anti-phishing behavior management feature which allows to measure awareness level of your employees.

    hashtag
    Training Modules

    Entrench training modules are offered in a variety of styles with full animation and narratives in many languages.

    hashtag
    Filmed Videos

    Security awareness sessions are no longer boring or dull. Sessions we offer based on (simplicity, Humor, ease of use and story-telling.

    hashtag
    Quizzes and Exams

    Entrench quizzes and exams can measure level of awareness that has been conveyed to the users.

    hashtag
    Customized Campaigns

    Awareness campaigns can be customized and targeted to either specific group of users or an entire department

    Zisoft is composed of several independent modules so you can pick and choose which modules you need to deploy. All modules are accessible from the same familiar user interface. The ZiSoft modules are

    1. Learning Management System

    2. Security Awareness Content

    3. Email Phishing Simulator

    hashtag
    Learning Management System

    Think of Zisoft LMS as your own private 'Coursera' or 'Udemy'. You use it to create courses complete with videos, slides, quizzes, exams, and certificates. Then you assign the courses to your employees and monitor their training in real-time. You can assign as many lessons you need to as many employees you need, and you can generate comprehensive reports in a variety of formats and charts.

    hashtag
    Security Awareness Content

    On top of the LMS, Zisoft offers 's security awareness content. These are predefined courses and exams that target security related topics. It offers 'Email Security', 'Data Leakage', 'Device Security', 'Browser Security', among many others.

    hashtag
    Email Phishing Simulator

    You are under a constant stream of phishing attacks whether you believe it or not. If you want to make sure, try our phishing simulator. With this simulator, you can send a 'controlled' and 'harmless' phishing email to a group of your organization users, and you can monitor in real time how many of them fall victim for those attacks. With the simulator, you can generate a report that tells you the percentage of your organization who is prone to phishing attacks, rank the departments according to their vulnerability, and conduct competitions for the employees to encourage them to be better at spotting phishing attacks.

    SeMA Survey Application Deployment Architecture

    A deployment architecture depicts the mapping of a logical architecture to a physical environment. The physical environment includes the computing nodes in an intranet or Internet environment, CPUs, memory, storage devices, and other hardware and network devices.

    Designing the deployment architecture involves sizing the deployment to determine the physical resources necessary to meet the system requirements specified during the technical requirements phase. You also optimize resources by analyzing the results of sizing the deployment to create a design that provides the best use of resources within business constraints.

    Section A: SeMA application sizing-estimation process .

    Web : PHP Laravel

    Laravel is a PHP based web-framework for building high-end web applications.

    hashtag
    Laravel Overview

    Laravel is an open-source PHP framework, which is robust and easy to understand. It follows a model-view-controller design pattern. Laravel reuses the existing components of different frameworks which helps in creating a web application. The web application thus designed is more structured and pragmatic.

    Laravel offers a rich set of functionalities which incorporates the basic features of PHP frameworks like CodeIgniter, Yii and other programming languages like Ruby on Rails. Laravel has a very rich set of features which will boost the speed of web development.

    Fawry DevOps internship Agenda

    circle-check

    Fawry DevOps internship Agenda:

    Start Date : 1 Nov 2022

    UI : Angular 8

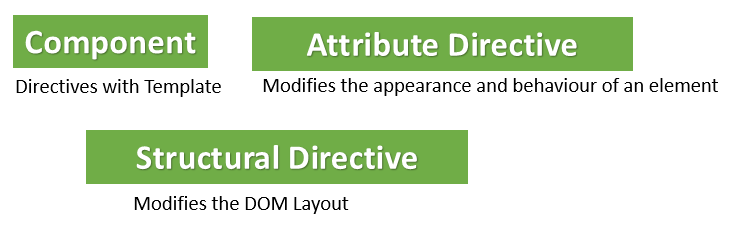
    open-source, client-side TypeScript based JavaScript framework
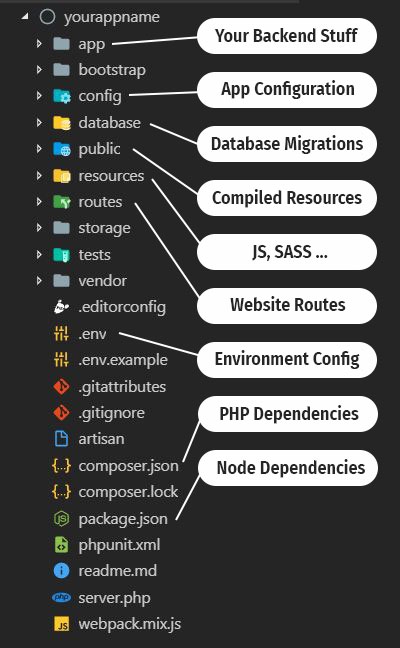
    hashtag
    Angular Overview

    Angular is a framework for building client applications in HTML and JavaScript or language like Typescript that compiles to JavaScript. This platform develop’s application across web, desktop and mobile application. The framework is developed by developers at Google and is being used by developers across the globe.

    Angular is used to build single page applications unlike the typical web application where on a click you need to wait for the page to re-load. This give you experience of a desktop or mobile app where part of the page will refresh asynchronously without refreshing the entire application.

    SeMA application sizing-estimation process .

    Shown below is a diagram of sizing-estimation process. It is not the only method for sizing deployment, but it should provide useful insight and guidance

    1. Estimate user concurrency and throughput

    In most use-case scenarios, the number of expected concurrent users is far less than the number of named users of system. A scenario in which all of the named users are simultaneously accessing the system is extremely rare. Normally, a globally distributed organization with users spread out all over the world experience about ⅓ of its named users online at any time during their individual 8-hour work days.

    Concurrency typically ranges from 10% to 50+% for App deployments.

    Application Security Course

    Prepared by Omar-Abdalhamid (Oct .2022)

    Application security refers to security precautions used at the application level to prevent the theft or hijacking of data or code within the application. It includes security concerns made during application development and design, as well as methods and procedures for protecting applications once they've been deployed.

    circle-info

    Course Overview Application security is the process of developing, adding, and testing security features within applications to prevent security vulnerabilities against threats such as unauthorized access and modification.

    All tasks that introduce a secure software development life cycle to development teams are included in application security shortly known as AppSec. Its ultimate purpose is to improve security practices and, as a result, detect, repair, and, ideally, avoid security flaws in applications. It covers the entire application life cycle, including requirements analysis, design, implementation, testing, and maintenance.

    Architecture

    ZiSoft Awareness Application Architecture

    hashtag
    ZiSoft SOA Architecture

    hashtag

    Non-Production Deployment

    Development and Test Deployment

    hashtag
    Quick start (ZiSoft Awareness Application )

    hashtag

    DB : MariaDB

    MariaDB. One of the most popular database servers. Made by the original developers of MySQL

    MariaDB Server is one of the most popular database servers in the world. It’s made by the original developers of MySQL and guaranteed to stay open source. Notable users include Wikipedia, WordPress.com and Google.

    MariaDB turns data into structured information in a wide array of applications, ranging from banking to websites. It is an enhanced, drop-in replacement for MySQL. MariaDB is used because it is fast, scalable and robust, with a rich ecosystem of storage engines, plugins and many other tools make it very versatile for a wide variety of use cases.

    MariaDB is developed as open source software and as a relational database it provides an SQL interface for accessing data. The latest versions of MariaDB also include GIS and JSON features.

    FAQ

    hashtag
    Does ZiSoft Awareness offer a desktop client or a mobile app

    No, all access to the system is done through the web application.

    hashtag

    Analytics : Metabase

    Metabase is an open source business intelligence tool

    Metabase is an open source business intelligence tool. It lets you ask questions about your data, and displays answers in formats that make sense, whether that’s a bar graph or a detailed table.

    Your questions can be saved for later, making it easy to come back to them, or you can group questions into great looking dashboards. Metabase also makes it easy to share questions and dashboards with the rest of your team.

    hashtag
    Install Prerequisites

    Section B : Deployment logical and physical Architecture .

    Section C : SeMA application HW sizing Specs .

    End Date : 15 Dec 2022

    Location : Fawry Quantum Building - Smart villagearrow-up-right Working Days from office : Monday , Wednesday

    DevOps Methodology :

    Git and Gitlab :

    Containerization [ Docker - Kubernertes ] :

    Continuous integration (CI) : Build CI on Gitlab-CI include stages:

    Continuous delivery (CD) : Fast-Forward Deployment Staging - Production :

    AWS Management Console

  • Setting up AWS Account and IAM (1 hour)

    • Creating an AWS account

    • Configuring Identity and Access Management (IAM)

    • Creating IAM users, groups, and roles

  • AWS Compute Services (2 hours)

    • Amazon EC2: Launching virtual servers

    • Amazon ECS: Container orchestration

    • AWS Lambda: Serverless computing

  • Lab 1: Launching an EC2 Instance (1 hour)

    • Step-by-step guidance on creating and launching an EC2 instance

    • Configuring security groups and key pairs

    • Connecting to the EC2 instance using SSH

  • Amazon Glacier: Long-term archival storage

  • AWS Database Services (2 hours)

    • Amazon RDS: Managed relational databases

    • Amazon DynamoDB: NoSQL database

    • Amazon Redshift: Data warehousing

  • Lab 2: Setting up an S3 Bucket and Uploading Files (1 hour)

    • Creating an S3 bucket

    • Configuring bucket policies and permissions

    • Uploading files to the S3 bucket

  • Amazon CloudFront: Content delivery network

  • AWS Security and Compliance (2 hours)

    • AWS Identity and Access Management (IAM)

    • AWS Security Groups and NACLs

    • AWS Web Application Firewall (WAF)

  • Lab 3: Creating a VPC and Launching an EC2 Instance (1 hour)

    • Creating a custom VPC

    • Configuring subnets, route tables, and internet gateways

    • Launching an EC2 instance within the VPC

  • AWS Trusted Advisor: Best practice recommendations

  • AWS DevOps and Deployment (2 hours)

    • AWS CodeCommit: Version control service

    • AWS CodeBuild: Continuous integration service

    • AWS CodeDeploy: Automated application deployment

  • Lab 4: Setting up Continuous Integration and Deployment (1 hour)

    • Setting up a CodeCommit repository

    • Configuring CodeBuild for continuous integration

    • Deploying an application using CodeDeploy

  • AWS Step Functions: Workflow orchestration

  • AWS AI and Machine Learning (2 hours)

    • Amazon Rekognition: Image and video analysis

    • Amazon Polly: Text-to-speech service

    • Amazon SageMaker: Machine learning platform

  • Lab 5: Building a Serverless API (1 hour)

    • Creating a Lambda function

    • Configuring API Gateway for RESTful API endpoints

    • Testing the serverless API

  • Benefits of using EKS and Fargate for containerized applications

  • Setting up AWS EKS Cluster (2 hours)

    • Creating an Amazon EKS cluster

    • Configuring cluster networking and security

    • Integrating with AWS Identity and Access Management (IAM)

  • Deploying Applications on AWS EKS (2 hours)

    • Working with Kubernetes pods, deployments, and services

    • Configuring container registries (e.g., Amazon ECR)

    • Deploying applications using YAML manifests

  • Lab 1: Creating an EKS Cluster and Deploying an Application (1 hour)

    • Step-by-step guidance on creating an EKS cluster

    • Deploying a sample application using Kubernetes manifests

    • Verifying the application deployment

  • Setting up AWS Fargate Cluster (2 hours)

    • Creating a Fargate cluster

    • Defining task definitions and containers

    • Configuring networking and security for Fargate tasks

  • Deploying Applications on AWS Fargate (2 hours)

    • Configuring Fargate task definitions

    • Task scheduling and auto-scaling

    • Managing container logs and monitoring

  • Lab 2: Creating a Fargate Cluster and Deploying an Application (1 hour)

    • Step-by-step guidance on setting up a Fargate cluster

    • Configuring task definitions and containers

    • Deploying a sample application on Fargate

  • Managing updates and rolling deployments

  • Monitoring and Logging with AWS EKS and Fargate (2 hours)

    • Configuring Amazon CloudWatch for monitoring

    • Collecting logs from EKS and Fargate

    • Analyzing metrics and logs for troubleshooting

  • Securing EKS and Fargate Workloads (2 hours)

    • Network security with VPC and security groups

    • Access control and permissions with IAM roles

    • Container security best practices

  • Lab 3: Scaling and Monitoring EKS and Fargate (1 hour)

    • Scaling EKS worker nodes and Fargate tasks

    • Configuring CloudWatch for monitoring

    • Analyzing logs and metrics for troubleshooting

  • Fawry Quantum Building - Smart villagearrow-up-right

    Git vs SVN

    It's a distributed version control system.

    It's a Centralized version control system

    Git is an SCM (source code management).

    Git has a cloned repository.

    SVN does not have a cloned repository.

    The Git branches are familiar to work. The Git system helps in merging the files quickly and also assist in finding the unmerged ones.

    The SVN branches are a folder which exists in the repository. Some special commands are required For merging the branches.

    Git does not have a Global revision number.

    SVN has a Global revision number.

    Git has cryptographically hashed contents that protect the contents from repository corruption taking place due to network issues or disk failures.

    SVN does not have any cryptographically hashed contents.

    Git stored content as metadata.

    SVN stores content as files.

    Git has more content protection than SVN.

    SVN's content is less secure than Git.

    Linus Torvalds developed git for Linux kernel.

    CollabNet, Inc developed SVN.

    Git is distributed under GNU (General public license).

    SVN is distributed under the open-source license.

    10 % [ Minimum ]

    5000

    500

    20 % [ Average ]

    5000

    1000

    30 % [ Recommended ]

    5000

    1500

    40 % [ Highly Scaled ]

    5000

    2500

    2. Estimate SeMA Application HW sizing

    circle-check

    A- Every CPU core handles 2 Worker B- Worker can handle 5 System Users or 20 Portal users C- Concurrent user = Users use app simultaneously with time session 5 sec D - Best practice of workers per machine from 17 to 33 [Due to processor queuing]

    3. Estimate SeMA DB HW sizing Database storage requirements may be estimated roughly using the following calculation:

    circle-check

    4. Estimate SeMA File Storage HW sizing

    circle-info

    hashtag
    SeMA App file storage can start with 4 TB and extend based on monitoring actual usage of storage

    Number of Users [ 5000 ]
    × Number of events per host per day [ 15 ]
    × 5Kb per event
    
    Number of Users × Number of events per host per day
    × 5Kb per event
    
    For example, an organization of 5,000 Users, with each user generating 
    an average of 15 events per day, 
    requiring a 30 day retention would require a database capacity of:
    
    Number of portal Users [5000]
    Number of concurrent users =  40 * 5000 / 100 = 2000 
    × Number of Woker = 2000 / 20 = 100 Woker 
    x Number of Workers / VM = 33
    x Number of Core / VM = 16 core 
    x RAM cacpity estimation [ 1 core * 4 ] = 16 * 4 = 64 Gb / VM
    
    Minimum 4 VM with 16 core / 64 Gb RAM
    Recommended 5 VM x with 16 core / 64 Gb RAM
     
    ## DB stoage sizing / Month
          5,000 × 15 × 5 × 30 = 11,250,000Kb, or 11Gb
    
    ## DB stoage sizing / Year
          11 GB per Month x 12 = 132 Gb / Year
    
    DB HW sizing for 5000 client connections / sec
    
    # DB Version: 14
    # OS Type: linux
    # DB Type: web
    # Total Memory (RAM): 96 GB
    # CPUs num: 24
    # Connections num: 5000
    # Data Storage: san
    
    max_connections = 5000
    shared_buffers = 24GB
    effective_cache_size = 72GB
    maintenance_work_mem = 2GB
    checkpoint_completion_target = 0.9
    wal_buffers = 16MB
    default_statistics_target = 100
    random_page_cost = 1.1
    effective_io_concurrency = 300
    work_mem = 1258kB
    min_wal_size = 1GB
    max_wal_size = 4GB
    max_worker_processes = 24
    max_parallel_workers_per_gather = 4
    max_parallel_workers = 24
    max_parallel_maintenance_workers = 4
    x Number of users  [ 5000 ]
    × Number of survey per user  per day  [ 2 ]
    × 25 Mb per survey attachment  [ 25 mb ]
    Number of Users × Number of survey per user  per day
    × 25 Mb per survey attachment
    
    ## File storage sizing / Month
    
          5,000 × 2 x 25 Mb × 30 = 750 Gb
    
    ## File storage sizing / Year
     
          750 GB per Month x 12 = 9 TB  / Year
    
    
    find the admin user, then click on “Password”
  • enter the password twice and click "Save".

  • if successful, you will see a confirmation message

  • General: Any other email you send that is not of the above types is called "general"

    click "Save"
    Click "Save"
    Click Save
    Click "Save"
    Click "Save"
    Add your question
  • Click on save

  • Then click on "Answers" on the newly created question

  • Add the desired list of answers, specifiying if it is correct or not for each answer.

  • From the "context" menu, select "Training"
  • Find the training campaign that you need to send emails for and click next

  • Choose the email server and email template that you need to use

  • You will see a list of "place holders" that appear below the template name. You can use them to override any placeholder manually. Usually, you will need to leave them alone.

  • Click "Send"

  • Choose the context in which this template will be used
  • Click Save

  • {link}: The special tracking number used in phishing Emails
  • {company_name}: The name of the company configured in the settings section

  • {email}: Email address of the receiver

  • {host}: The host address configured in the settings section

  • {phishpot_title}: The name of a phishpot campaign

  • {campaign_title}: The name of a training campaign

  • Choose the phishing page
  • Click save

  • Click save
    Click save
    Add the appropriate parameters to the selected dashboard (e.g. the campaign id or the phishpot id)
    https://big-company.com/awarenessarrow-up-right
    https://awareness.my-company.com/arrow-up-right
    https://yourcompany.zisoftonline.comarrow-up-right
    http://coolwebsite.com?link=hdhfey37ehfbfarrow-up-right
    linkedin@company-inc.comenvelope
    linkedin@zisoftonline.comenvelope
    linkedin.zisoftonline.comarrow-up-right
    MetaBasearrow-up-right
    support@zisoftonline.comenvelope
    Zisoft Home
    Zisoft Lesson
    Zisoft Linkedin
    Zisoft Office

    If you are familiar with Core PHP and Advanced PHP, Laravel will make your task easier. It saves a lot time if you are planning to develop a website from scratch. Moreover, a website built in Laravel is secure and prevents several web attacks.

    hashtag
    Advantages of Laravel

    Laravel offers you the following advantages, when you are designing a web application based on it −

    • The web application becomes more scalable, owing to the Laravel framework.

    • Considerable time is saved in designing the web application, since Laravel reuses the components from other framework in developing web application.

    • It includes namespaces and interfaces, thus helps to organize and manage resources.

    hashtag
    Composer

    Composer is a tool which includes all the dependencies and libraries. It allows a user to create a project with respect to the mentioned framework (for example, those used in Laravel installation). Third party libraries can be installed easily with help of composer.

    All the dependencies are noted in composer.json file which is placed in the source folder.

    hashtag
    Artisan

    Command line interface used in Laravel is called Artisan. It includes a set of commands which assists in building a web application. These commands are incorporated from Symphony framework, resulting in add-on features in Laravel 5.1 (latest version of Laravel).

    hashtag
    Features of Laravel

    Laravel offers the following key features which makes it an ideal choice for designing web applications −

    hashtag
    Modularity

    Laravel provides 20 built in libraries and modules which helps in enhancement of the application. Every module is integrated with Composer dependency manager which eases updates.

    hashtag
    Testability

    Laravel includes features and helpers which helps in testing through various test cases. This feature helps in maintaining the code as per the requirements.

    hashtag
    Routing

    Laravel provides a flexible approach to the user to define routes in the web application. Routing helps to scale the application in a better way and increases its performance.

    hashtag
    Configuration Management

    A web application designed in Laravel will be running on different environments, which means that there will be a constant change in its configuration. Laravel provides a consistent approach to handle the configuration in an efficient way.

    hashtag
    Query Builder and ORM

    Laravel incorporates a query builder which helps in querying databases using various simple chain methods. It provides ORM (Object Relational Mapper) and ActiveRecord implementation called Eloquent.

    hashtag
    Schema Builder

    Schema Builder maintains the database definitions and schema in PHP code. It also maintains a track of changes with respect to database migrations.

    hashtag
    Template Engine

    Laravel uses the Blade Template engine, a lightweight template language used to design hierarchical blocks and layouts with predefined blocks that include dynamic content.

    hashtag
    E-mail

    Laravel includes a mail class which helps in sending mail with rich content and attachments from the web application.

    hashtag
    Authentication

    User authentication is a common feature in web applications. Laravel eases designing authentication as it includes features such as register, forgot password and send password reminders.

    hashtag
    Redis

    Laravel uses Redis to connect to an existing session and general-purpose cache. Redis interacts with session directly.

    hashtag
    Queues

    Laravel includes queue services like emailing large number of users or a specified Cron job. These queues help in completing tasks in an easier manner without waiting for the previous task to be completed.

    hashtag
    Event and Command Bus

    Laravel 5.1 includes Command Bus which helps in executing commands and dispatch events in a simple way. The commands in Laravel act as per the application’s lifecycle.

    hashtag
    Get started

    • PHP having version 7.0 or upper version

    • An OpenSSL Extension for PHP

    • A PDO Extension for PHP

    • Mbstring Extension for PHP

    • Tokenizer Extension for PHP

    • XML Extension for PHP

    hashtag
    Composer

    Laravel implements composer for managing dependencies within it. Hence, before use of Laravel, it needs to check whether you have composer setup on your system or not.

    If you don't have composer installed on your computer, first visit this URL to download composer:

    https://getcomposer.org/download/arrow-up-right

    When you are done installing the composer, cross-check whether it is installed or not, by typing in the command prompt the composer command. You can see the Composer screen in that CMD only.

    It needs to be kept in mind to put the composer's system-wide vendor in bin directory within your $PATH; as a result, your system can locate the executable of laravel. Depending on which operating system you are using, this directory will exist. Still, for PCs having OS like MAC and Linux, it will be:

    hashtag
    Setup Laravel using Installer

    First of all, you have to download the installer of Laravel with the help of Composer, like this:

    When the installation is done, new command of laravel will start a new fresh installation in that directory you provide.

    hashtag
    Create Project

    The next thing you have to do is make a new folder in some specific path within your system, for keeping your Laravel projects. Move to that location where the directory is created. For installing the Laravel, the following command you have to type:

    The command mentioned above will make Laravel installed on that specific directory. Type the next command:

    This above code will start Laravel service. A black screen will appear showing the message: Laravel Development server started on http://localhost:8080

    Copy and paste: http://localhost:8080 in your browser, and you can see Laravel home screen appears in your browser.

    hashtag
    Laravel Project Structure

    The top folder, named app is where most of our back-end code will go. We won't go into detail on every single sub directory or file and will concentrate on the ones we'll mostly use, through development of this app.

    Laravel Folder Structure

    hashtag
    App

    It is the application folder and includes the entire source code of the project. It contains events, exceptions and middleware declaration. The app folder comprises various sub folders as explained below

    This is another Laravel directory which holds other subdirectories for additional purposes. These are:

    Directory

    Description

    Console

    The Console directory contains all your project artisan commands.

    Events

    The Events directory hold event files that your laravel application may pop up. Events is used for sending messages or signals to other parts of the laravel project that any action had taken place within the project.

    Exceptions

    The Exceptions directory holds your laravel project's exception handling files which handles all the exceptions thrown by your Laravel project.

    Http

    The Http directory holds different filters, requests, and controllers.

    Jobs

    The Jobs directory holds all lineup jobs in this directory. But it does not get created initially, rather, you need to type and run this artisan command:

    hashtag
    Bootstrap

    This folder encloses all the application bootstrap scripts. It contains a sub-folder namely cache, which includes all the files associated for caching a web application. You can also find the file app.php, which initializes the scripts necessary for bootstrap.

    hashtag
    Config

    The config folder includes various configurations and associated parameters required for the smooth functioning of a Laravel application. Various files included within the config folder are as shown in the image here. The filenames work as per the functionality associated with them.

    hashtag
    Database

    As the name suggests, this directory includes various parameters for database functionalities. It includes three sub-directories as given below −

    • Seeds − This contains the classes used for unit testing database.

    • Migrations − This folder helps in queries for migrating the database used in the web application.

    • Factories − This folder is used to generate large number of data records.

    hashtag
    Public

    It is the root folder which helps in initializing the Laravel application. It includes the following files and folders −

    • .htaccess − This file gives the server configuration.

    • javascript and css − These files are considered as assets.

    • index.php − This file is required for the initialization of a web application.

    hashtag
    Resources

    Resources directory contains the files which enhances your web application. The sub-folders included in this directory and their purpose is explained below −

    • assets − The assets folder include files such as LESS and SCSS, that are required for styling the web application.

    • lang − This folder includes configuration for localization or internalization.

    • views − Views are the HTML files or templates which interact with end users and play a primary role in MVC architecture.

    Observe that the resources directory will be flattened instead of having an assets folder. The pictorial representation of same is shown below −

    Resource Directory Changes

    hashtag
    Storage

    This is the folder that stores all the logs and necessary files which are needed frequently when a Laravel project is running. The sub-folders included in this directory and their purpose is given below −

    • app − This folder contains the files that are called in succession.

    • framework − It contains sessions, cache and views which are called frequently.

    • Logs − All exceptions and error logs are tracked in this sub folder.

    hashtag
    Tests

    All the unit test cases are included in this directory. The naming convention for naming test case classes is camel_case and follows the convention as per the functionality of the class.

    hashtag
    Vendor

    Laravel is completely based on Composer dependencies, for example to install Laravel setup or to include third party libraries, etc. The Vendor folder includes all the composer dependencies.

    hashtag
    Request Life Cycle of Laravel

    Auto Loader

    As a first step, the request will be triggered from the user’s browser, then it will reach web server. Web server (Apache or Nginx) will redirect the given request to Laravel public/index.php file which is simply a starting point for loading the rest of the framework. It loads the auto loader files which is generated by composer.

    Then it retrieves an instance of the Laravel application from bootstrap/app.php script. Laravel itself creates an instance of the application, is the initial/first step.

    Kernel

    Next step will occur on the Kernel part of the application.

    The incoming request is sent to either the HTTP kernel or the console kernel, depending on the type of request that is entering the application .These two kernels serve as the central location that all requests flow through.

    HTTP kernel, which is placed in app/Http/Kernel.php. It just receive a Request and return a Response. Bootstrappers that are defined by the Kernel class, which configures error handling, configure logging, detect environments and other tasks to be done before the request handled.

    HTTP Kernel will define the list of middleware that are passed through before handled by application.

    Service Providers

    Next step of the kernel is to load service providers as part of the bootstrapping action. Providers that are needed for the application are placed in config/app.php configuration file.

    While the register method calls, all the providers will be registered. Once all providers are registered, then boot method will be called.

    Dispatch Request

    Once the application have been bootstrapped and all service providers are registered and booted, the request will be handed over to the router for dispatching. The router will dispatch the request to a route or controller, as well as run any route specific middleware.

    Router:

    Now request will be dispatched by the Router and it will end up with the views as shown below:

    Router will direct the HTTP Request to a Controller or return a view or responses directly by omitting the controller. These routes will be placed in app/routes.php.

    Controller app/controllers/ performs specific actions and sends data to a View.

    View app/views/ formats the data appropriately, providing the HTTP Response.

    The above steps are clearly explained in the diagrammatical view below.

    Laravel - Request Life Cycle

    Let’s see an example for a request

    Step 1

    The user input http://xyz.com in the browser and hits ‘enter’.

    Step 2

    Once the user hit this URL, the browser will send the page request over the Internet to the web server.

    Step 3

    Web server will receive the request and analyze the request information. In web server’s configuration file, site’s root path is specified. Based on that, web server will look for index.php file in that root directory, since URL doesn’t contain any sub directory or any other routes.

    Step 4

    Web server will direct the request to public/index.php file of laravel application.

    Step 5

    In this step, PHP Interpreter is executing the code contained in the index.php file from the request. During this step, auto loader files which are generated by composer will be loaded.

    Step 6

    Then it will create the laravel instance and bootstrapping the components of laravel.

    Step 7

    The kernel will receive the request, load the service providers and will be redirected to router.

    Step 8

    Router will render the view file content and return back to web server.

    Step 9

    Web server receives the output from PHP and sends it back over the Internet to a user’s web browser.

    Step 10

    The user’s web browser receives the response from the server, and renders the web page on user’s computer.

    hashtag
    Configuring in Laravel Project

    hashtag
    Configuring the Basic in Laravel Project

    If you are new to Laravel, then you should know that you have the provision to create configuration files for Laravel application. After installing Laravel, you need to perform the permission writing for your storage directory along with the bootstrap/cache.

    Next, you have to do is, generating the application key for session securing and encrypted data keys also. In case, the root directory doesn't have the .env file, in that case, you will have to rename the file .env.example to .env and run the command mentioned below where you've installed the Laravel:

    You can see in the .env file the newly generated key. Moreover, it is also possible to configure time zone as well as a locale in the config/app.php file of your project.

    hashtag
    Configuring the Environment

    By default, the .env file includes following parameters −

    hashtag
    Important Points

    While working with basic configuration files of Laravel, the following points are to be noted −

    • The .env file should not be committed to the application source control, since each developer or user has some predefined environment configuration for the web application.

    • For backup options, the development team should include the .env.example file, which should contain the default configuration.

    hashtag
    Configuring the Database

    You can configure the database for your application using the config/database.php file of your project. Setting the configuration constraint utilized by various databases can also be done, and moreover, Laravel also allowed us to use the default one as well.

    hashtag
    Maintenance Modes

    Websites are regularly modified. As s a developer for this, you have to put your site in maintenance mode. In this advanced framework, it becomes easier to do that by using two artisan commands. Let's see how to use the commands:

    For starting your project maintenance approach, the following command is required:

    After changing the required stuff, when it is time to re-run your project, the following command is required:

    Angular Component Request

    During page redirects many sections of the page like header/footer and some functionality remains unchanged and hence instead of reloading everything Angular helps to load changed content dynamically, this increases the speed and performance of the application. Angular helps to achieve this.

    hashtag
    Why Angular ?

    Performance Faster initial Load, change detection and great rendering time.

    Component based Development: In Angular 8 everything is component and this is the term you will hear and work the most. They are the building block of Angular application. So you get greater code reuse and the code is unit testable.

    Client Side Templating: Using templates in the browser is becoming more and more widespread. Moving application logic from the server to the client, and the increasing usage of MVC-like patterns (model–view–controller) inspired templates to embrace the browser. This used to be a server-side only affair, but templates are actually very powerful and expressive in client-side development as well.

    Mobile Support: (Cross Platform Support) With angular you can create SPA apps that work on web and great on mobile.

    hashtag
    Getting Started with Angular

    From the terminal, install the Angular CLI globally with:

    This will install the command ng into your system, which is the command you use to create new workspaces, new projects, serve your application during development, or produce builds that can be shared or distributed.

    Create a new Angular CLI workspace using the ng newarrow-up-right command:

    From there you replace the /src folder with the one from your StackBlitz download, and then perform a build.

    hashtag
    Angular 8 Architecture

    The basic building blocks of an Angular application are NgModules, which provide a compilation context for components. NgModules collect related code into functional sets; an Angular app is defined by a set of NgModules. An app always has at least a root module that enables bootstrapping, and typically has many more feature modules.

    • Components define views, which are sets of screen elements that Angular can choose among and modify according to your program logic and data.

    • Components use services, which provide specific functionality not directly related to views. Service providers can be injected into components as dependencies, making your code modular, reusable, and efficient.

    Key parts of Angular 8 Architecture:

    hashtag
    Angular 8 Components

    In Angular 8, Components and services both are simply classes with decorators that mark their types and provide metadata which guide Angular to do things.

    Every Angular application always has at least one component known as root component that connects a page hierarchy with page DOM. Each component defines a class that contains application data and logic, and is associated with an HTML template that defines a view to be displayed in a target environment.

    Metadata of Component class

    • The metadata for a component class associates it with a template that defines a view. A template combines ordinary HTML with Angular directives and binding markup that allow Angular to modify the HTML before rendering it for display.

    • The metadata for a service class provides the information Angular needs to make it available to components through dependency injection (DI).

    hashtag
    MODULE

    Angular bring the concept of Modularity, where you can make a single application by separating into many modules.

    • A module is a mechanism to group components, directives and services that are related, in such a way that can be combined with other modules to create an application

    • You can think of Modules as Boxes where you separate and organize application functionality into features and reusable chunks. You can think of them much like packages and namespaces of Java AND C#.

    hashtag
    TEMPLATES

    Now each Component has a HTML Templates which is the View that displays the information on the browser. So template looks like regular HTML but we just sprinkle Angular syntax’s and custom components on the page. You use interpolation to weave calculated strings into the text between HTML element tags and within attribute assignments. Structural directives are responsible for HTML layout.

    There are two types of data binding:

    1. Event Binding: Event binding is used to bind events to your app and respond to user input in the target environment by updating your application data.

    2. Property Binding: Property binding is used to pass data from component class and facilitates you to interpolate values that are computed from your application data into the HTML.

    hashtag
    DIRECTIVE

    Angular templates are dynamic. When Angular renders them, it transforms the DOM according to the instructions given by directives. Angular ships with built-in directives and you can write your own directives. A directive is a class with a @Directive decorator. A component is a directive-with-a-template; a @Component decorator is actually a @Directive decorator extended with template-oriented features. There are other built-in directives, classified as either attribute directives or structural directives and they are used to modify the behavior and structure of other HTML elements.

    hashtag
    DATA BINDING

    Now if you have worked on Jquery and JavaScript then you must know the pain to push data values into HTML Controls and then tracking user response and actions. We always have errors to bind and understanding the binding was always difficult. Angular Supports Data Binding which is kind of a connection between View and application data values (Business Logic). This Data Binding make the application simple to read, write and maintain as these operation are maintained by binding framework. Based on the flow of data, you may have three kinds of data Binding also you may have different ways (or more than one way to achieve) the same.

    • View to Source (HTML Template to Component) : Event Binding ()

    • Source to View (Component to HTML Template) : Property Binding / Interpolation []

    • Two way (View to Source & Source to view) : Banana in a Box [()]

    hashtag
    Services

    Let’s see a scenario we developed a component and this component became famous so many people may ask for it. Or another scenario may be that your project require a piece of code to be used in many places. For these kind of scenarios we can create a service which bring re-usability and reduce the overhead required to develop debug and test the duplicate code in multiple place instead of having that in a single place.

    hashtag
    Angular 8 Project Structure

    Angular Folder Structure

    hashtag
    src Folder

    This is where the actual action happen, where we keep our source code like component, modules, templates, services, directives, images etc. Things we will look here:-

    • app Folder

    • environments Folder

    • Index.html

    • Main.ts & Polyfills.ts

    hashtag
    app Folder

    The sub-folder /app/ under /src/ contain our modules and component. Every angular application comes up with at-least one module and component.

    • Module groups component which are dedicated for the functioning of an application. The module file is named as app.module.ts and there is at-least one module inside an angular application.

    • While the component defines the view (things you see on browser) and the application logic. A module can have lots of component.

    To see how the call of files happen inside the angular folder structure, please refer the above diagram. It all start with the 1) Main.ts the entry point from which 2) app.Module.ts gets called which in turns call a particular 3) App.component.ts file. Under /src/ folder we have other files and folders as shown in the above image

    a) assets : Store’s all the static files like Images and icons etc. used within your application b) favicon.ico : The icon for your App c) style.css : Global CSS and stylesheet which can be used by all your pages and components d) test.ts : Configuration used for setting the testing environment

    hashtag
    environments Folder

    The sub-folder /environments/ under /src/ contain 2 files each for different environment and they are used to store configuration information like database credential, server address, or some property that differs across those environments

    1) environment.ts: This environment file is used by default and is used during the development. If you open this file you will notice that production property is set to false. 2) environment.prod.ts: It is used during the production build, this is called when you build your application with ng build –env=prod .

    hashtag
    Index.html

    This is the file called by the user. A plain html file which contains your angular directive (e.g. <app-root></app-root>) which calls the angular component. Also when you open the file you don’t see any referenceto CSS as those are injected during the build process.

    hashtag
    Main.ts & Polyfills.ts

    Main.ts :- This is the starting point of the app. It is here your application get compiled with Just In Time compiler and then it bootstraps or load the Module called AppModule which is the root module of the application. Every angular application has at-least one Angular Module called the root module which is called the AppModule.

    Polyfills.ts :- Angular is built on the latest standards of the web platform which target a wide range of browsers and this becomes challenging to ensure things do not break in the old browsers. Polyfills are workaround scripts that ensure that your recent codes (which use the new browser features) do not break in the old browsers (which do not support the new browser features).

    hashtag
    Angular.json

    Angular.json at the root level of an Angular workspace provides workspace-wide and project-specific configuration defaults for build and development tools provided by the Angular CLI. This file also defines settings and configuration for various features and files and help set naming conventions, pointing to correct files in the solution and also changing settings during the project build. With Angular 6 and later we have the workspace concept where collection of angular projects can co-locate where few properties configure the workspace. Then there is a project section where you will have per project individual configuration.

    Main properties that we find in the angular.json file that configure workspace and projects properties are –

    1. $schema: used by Angular CLI in order to enforce the specification of Angular workspace schema , this $schema property refers to angular CLI implementation file.

    2. Version: The configuration-file version.

    3. newProjectRoot: Path where new projects are created.

    4. projects: Contain a subsection for each project (library or application) in the workspace.

    5. defaultProject: When you use ng new to create a new app in a new workspace, this app gets creates as a default project in the workspace.

    hashtag
    Package.json

    This contain list of packages required to build and run our angular application. There are two lists of such packages called dependencies and dev dependencies. dependencies: Normal project dependency which are both required during runtime and development. You can think of them as a reference to mandatory modules. devDependencies : These modules are only required during the development and they don’t get called actual project release or runtime. This file also contains some basic information about project like (name, description, license etc). The interesting part here is the scripts section which takes Key/Value as input. Each one of the keys in these key/value pairs is the name of a command that can be run and the corresponding value of each key is the actual command that is run.

    hashtag
    tsconfig.json

    Typescript is the primary language for Angular application but the problem is that browsers don’t understand this language, so the typescript must be transpiled into the Javascript. Hence this file defines the compiler option required to compile the project

    hashtag
    Angular 8 Lazy Loading

    Angular announced a new version 8.0 and its improved few methods and the compiler to reduce the bundle size 40% less. Now time to update my previous article Angular Routing with Lazy loading Design Pattern.

    Angular 8 Lazy Load Routing.

    hashtag
    Angular Test

    Unit Testing

    This is sometimes also called Isolated testing. It’s the practice of testing small isolated pieces of code. If your test uses some external resource, like the network or a database, it’s not a unit test.Functional Testing

    This is defined as the testing of the complete functionality of an application. In practice with web apps, this means interacting with your application as it’s running in a browser just like a user would interact with it in real life, i.e. via clicks on a page.

    This is also called End To End or E2E testing.

    hashtag
    Jasmine

    Jasmine is a javascript testing framework that supports a software development practice called Behaviour Driven Developmentarrow-up-right, or BDD for short. It’s a specific flavour of Test Driven Developmentarrow-up-right (TDD).

    Jasmine, and BDD in general, attempts to describe tests in a human readable format so that non-technical people can understand what is being tested. However even if you are technical reading tests in BDD format makes it a lot easier to understand what’s going on.

    For example if we wanted to test this function:TypeScript

    We would write a jasmine test spec like so:TypeScript

    One

    The describe(string, function) function defines what we call a Test Suite, a collection of individual Test Specs.

    Two

    The it(string, function) function defines an individual Test Spec, this contains one or more Test Expectations.

    Three

    The expect(actual) expression is what we call an Expectation. In conjunction with a Matcher it describes an expected piece of behaviour in the application.

    Four

    The matcher(expected) expression is what we call a Matcher. It does a boolean comparison with the expected value passed in vs. the actual value passed to the expect function, if they are false the spec fails.

    hashtag
    Built-in matchers

    Jasmine comes with a few pre-built matchers like so:TypeScript

    You can see concrete examples of how these matchers are used by looking at the Jasmine docs here: http://jasmine.github.io/edge/introduction.html#section-Included_Matchersarrow-up-right

    hashtag
    Setup and teardown

    Sometimes in order to test a feature we need to perform some setup, perhaps it’s creating some test objects. Also we may need to perform some cleanup activities after we have finished testing, perhaps we need to delete some files from the hard drive.

    These activities are called setup and teardown (for cleaning up) and Jasmine has a few functions we can use to make this easier:beforeAll

    This function is called once, before all the specs in describe test suite are run.afterAll

    This function is called once after all the specs in a test suite are finished.beforeEach

    This function is called before each test specification, it function, has been run.afterEach

    This function is called after each test specification has been run.

    We might use these functions like so:TypeScript

    hashtag
    Running Jasmine Test

    To manually run Jasmine tests we would create a HTML file and include the required jasmine javascript and css files like so:HTML

    We then load in the parts of our application code that we want to test, for example if our hello world function was in main.js:HTML

    circle-exclamation

    Important : The order of script tags is important.

    We then would load each individual test suite file, for example if we placed our test suite code above in a file called test.js we would load it in like so:HTML

    To run the tests we simply open up the HTML file in a browser.

    Once all the files requested via script and link are loaded by a browser the function window.onload is called, this is when Jasmine actually runs the tests.

    The results are displayed in the browser window, a failing run looks like:

    jasmine fail

    A passing run looks like:

    jasmine pass

    If we wanted to test our code in different browsers we simply load up the HTML file in the browser we want to test in.

    If we wanted to debug the code we would use the developer tools available to us in that browser.

    hashtag
    Karma

    Manually running Jasmine tests by refreshing a browser tab repeatedly in different browsers every-time we edit some code can become tiresome.

    Karma is a tool which lets us spawn browsers and run jasmine tests inside of them all from the command line. The results of the tests are also displayed on the command line.

    Karma can also watch your development files for changes and re-run the tests automatically.

    Karma lets us run jasmine tests as part of a development tool chain which requires tests to be runnable and results inspectable via the command line.

    It’s not necessary to know the internals of how Karma works. When using the Angular CLI it handles the configuration for us and for the rest of this section we are going to run the tests using only Jasmine.

    hashtag
    Dashboard ngx-admin

    ngx-admin is a front-end admin dashboard template based on Angular 8+, Bootstrap 4+ and Nebulararrow-up-right. That means all the data you can see on graphs, charts and tables is mocked in Javascript so you can use the backend of your choice with no limitations.

    admin dashboard based on Angular 8+

    hashtag
    List of features

    • Angular 8+ & Typescript

    • Bootstrap 4+ & SCSS

    • Responsive layout

    • RTL support

    • High resolution

    • Flexibly configurable themes with hot-reload (3 themes included)

    • Authentication module with multiple providers

    • Lots of awesome features:

      • Buttons

      • Modals

    hashtag
    Theme System

    Nebulararrow-up-right Theme System is a set of rules we put into how SCSS files and variables are organized to achieve the following goals:

    • ability to flexibly change looks & feel of the application by managing variables, without changing SCSS itself;

    • ability to switch between visual themes in a runtime without reloading the page;

    • support of CSS-variables (implemented partially).

    hashtag
    Theme Map

    Each theme is represented as an SCSS map with a list of key-value pairs:

    Where key - is a variable name, and value - is a raw SCSS value (color, string, etc) or parent variable name, so that you can inherit values from different variables:

    Here font-secondary inherits its value from font-main.

    hashtag
    Component Variables

    Then, for each component of the Nebular Components, there is a list of variables you can change. For example - header component variables:

    As you can see, you have 8 variables for a pretty simple component and from the other side, 6 of them are inherited from the default values. It means that if you want to create a new theme with a united look & feel of the components - in most cases you would need to change around 10 generic variables, such as color-bg, shadow, etc. to change the UI completely.

    List of component style variables is specified in the component documentation, for example styles for header componentarrow-up-right.

    hashtag
    Variables Usage

    Now, if you want to use the variables in your custom style files, all you need to do (of course, after the successful setup of the Theme Systemarrow-up-right is to call nb-theme(var-name) function:

    Depending on the currently enabled theme and the way card-bg inherited in your theme, you will get the right color.

    hashtag
    Built-in themes

    Currently, there are 3 built-in themes:

    • default - clean white theme

    • cosmic - dark theme

    • corporate - firm business theme

    Themes can also be inherited from each other, cosmic, for instance, is inherited from the default theme.

    hashtag
    Magic of multiple themes with hot-reload

    As you can see from the ngx-admin emoarrow-up-right, you can switch themes in the runtime without reloading the page. It is useful when you have multiple visual themes per user role or want to provide your user with such a configuration so that he can decide which theme works best for him. The only requirement for the feature to work is to wrap all of your component styles into special mixin nb-install-component and use nb-theme to get the right value:

    hashtag
    Backend Integration

    This section describes approaches of integration of ngx-admin application with backend API. Despite we understand that every backend is really different, we think that we can cover several most commonly used ways.

    hashtag
    Integration with JSON REST server

    Despite there's an option to do CORS requests to API server directly, we don't advise to do so. This way has disadvantages in terms of security and performance. In terms of security when you do CORS request you basically expose your API server URL to everybody. Your API server should take additional measures to make sure some URLs are not accessible, because it is exposed to the web. As for performance, CORS requests require to send preflight OPTIONS request before each HTTP request. This adds additional HTTP overhead.

    The solution we suggest is to use proxy for your API server. In this case you can make your app accessible through some sub-url. For example, if your application's hosted under url website.com and your index file is located at website.com/index.html, you can make your API root accessible on website.com/api. This is well supported by angular-cli/webpack-dev-server for development setup and by web servers for production setup. Let's review these setups:

    hashtag
    angular-cli/webpack-dev-server setup

    There's not so much needs to be done to proxy your api using angular-cli. You can read detailed documentation in their docsarrow-up-right. But the most important topics are:

    You should create proxy.conf.json file in your application root. The file should contain something like below:

    In this case you should put URL of your API server instead of http://localhost:3000.

    After that you need to run your angular-cli application using following command

    That's it. Now you can access /api URL from your ngx-admin application and your requests will be forwarded to your API server.

    hashtag
    Production setup

    Production setup is not much different from development setup. The only difference is that usually you don't use there angular-cli or webpack-dev-server to host your HTML/CSS/JS. Usually we all use some web server for that. At Akveo we mostly use nginxarrow-up-right for this use case. Below there is a sample configuration for this particular web server. For others it is not that much different.

    Usually you create new virtual host with some similar configuration:

    The only thing you need to add is proxy-pass to /api URL like below:

    That's it. Now your API server works on production as well.

    hashtag
    Course Outline

    Day
    Description

    Day 1

    Application Security Introduction

    Day 2

    Methodologies & VAPT

    Day 3

    Secure Coding [ input validation & Session Management ]

    Day 4

    Risk Rating , Threat Modeling , Encryption and Hashing

    Day 5

    DevSecOps

    hashtag

    hashtag
    Course content

    circle-check

    Day 1 : Application Security Introduction

    Overview: The first section of the course will set the stage for the course with the fundamentals of web applications such as the HTTP protocol and the various mechanisms that make web applications work. We then transition over to the architecture of the web applications which plays a big role in securing the application.

    Topics:

    • Application Security Introduction

    • Application Security Terms and Definitions

    • Application Security Goals

    circle-check

    Day 2: Methodologies & VAPT.

    Methodologies for developing secure code:

    • Risk analysis

    • Threat modeling

    • Lab : Threat modeling - exercise

    • OWASP community Guidelines for secure coding

    • Verification testing .

    VAPT (Vulnerability Assessment and Penetration Test)

    • Introduction to HTTP Protocol

    • Overview of Web Authentication Technologies

    • Web Application Architecture

    circle-check

    Day 3 : Secure Coding [ input validation & Session Management ]

    Secure Coding input validation:

    • SQL Injection vulnerability

    • Lab : SQL Injection vulnerability Lab

    • LDAP and XPath Injection vulnerabilities

    • Cross-Site Scripting (XSS) vulnerability

    • Lab : Cross-Site Scripting (XSS) vulnerability Lab

    • OS Command Injection vulnerability

    • Lab : OS Command Injection vulnerability Lab

    • LFI (Local File Inclusion) and RFI (Remote File Inclusion) vulnerabilities

    • Lab : LFI / RFI vulnerabilities Lab

    • Invalidated File Upload vulnerability

    • Lab : Invalidated File Upload vulnerability Lab

    • Buffer Overflow vulnerabilities

    • XXE (XML External Entities) Vulnerabilities

    • Lab : XXE (XML External Entities)

    • Insecure Deserialization

    circle-check

    Day 4 : Risk Rating , Threat Modeling , Encryption and Hashing

    Risk Rating and Threat Modeling:

    • Risk Rating Introduction

    • Lab : Risk Rating Demo

    • Introduction to Threat Modeling

    • Type of Threat Modeling

    • Introduction to Manual Threat Modeling

    • Lab : Manual Threat Model demo

    Encryption and Hashing:

    • Encryption Overview

    • Encryption Use Cases Hashing

    • Lab : Overview Hashing Demo PKI (Public Key Infrastructure)

    circle-check

    Day 5 : DevSecOps

    • SAST (Static Application Security Testing)

    • Lab : Spot Bugs Demo .

    • SCA (Software Composition Analysis)

    • Lab : Snyk Open-Source (SCA)

    • DAST (Dynamic Application Security Testing)

    • Lab : OWASP ZAP Scanning .

    • IAST (Interactive Application Security Testing)

    • RASP (Runtime Application Self-Protection)

    • WAF (Web Application Firewall) Penetration Testing

    • SCA (Software Composition Analysis)

    1-
    Ingress Server ( Nginx ) :

    Nginx has focused on high performance, high concurrency and low memory usage web server functionality, like load balancing, caching, access and bandwidth control, and the ability to integrate efficiently with a variety of applications

    • HTTP Handler

    • Serving Static Content

    • NGINX Reverse Proxy

    • NGINX Content Caching

    • Compression and Decompression

    • Secure Connect with SSL CA

    hashtag
    2- UI Server ( Angular ) :

    Frontend part of the application that users can see and interact with directly in order to receive the backend capabilities of the system. It involves everything that the user can see, touch and experience.

    hashtag
    3- Web Application Server ( Laravel) :

    Laravel is a web application framework with expressive, elegant syntax. ... Laravel attempts to take the pain out of development by easing common tasks used in the majority of web projects, such as authentication, routing, sessions, and caching

    - AUTHORIZATION TECHNIQUE :

    Laravel provides a simple way to organize authorization logic and control access to resources.

    - OBJECT-ORIENTED LIBRARIES :

    pre-installed libraries to implement many advanced features, such as checking active users, Bcrypt hashing, password reset, CSRF (Cross-site Request Forgery) protection, and encryption.

    -ARTISAN :

    Developer has to usually interact with the Laravel framework using a command line that creates and handles the Laravel project environment.

    -MVC SUPPORT :

    Supports MVC Architecture ensuring clarity between logic and presentation. MVC helps in improving the performance, allows better documentation, and has multiple built-in functionalities.

    -SECURITY :

    Ues Bcrypt hashing algorithm for generating an encrypted representation of a password. Laravel uses prepared SQL statements which make injection attacks unimaginable. Along with this, Laravel provides a simple way to escape user input to avoid user injection of tag.

    -SSO Integration :

    • One-click sign-in: Allows collaborators to sign in from your SSO provider without maintaining a separate username and password.

    • Automatic provisioning: Allows authorized users to create account when they require access.

    -LDAP Integration :

    LDAP integration allows your instance to use your existing LDAP server as the master source of user data.Administrators integrate with a Lightweight Directory Access Protocol (LDAP) directory to streamline the user login process and to automate administrative tasks such as creating users and assigning them role

    hashtag
    4- Analytics server ( Metabase ) :

    Analyzing data and presenting actionable information which helps executives, managers and other corporate users make informed training/phishing decisions.

    - ETL : Extract, Transform and Load. An ETL tool extracts the data from different RDBMS source systems, transforms the data like applying calculations, concatenate, etc.

    - BI : information management tool that is used to track KPIs, metrics, and other key data points relevant to a business, department, or specific process. Through the use of data visualizations, dashboards simplify complex data sets to provide users with at a glance awareness of current performance.

    hashtag
    5- Cron server :

    Laravel command scheduler allows for the fluent and expressive defining of command schedule within Laravel itself, and only a single Cron entry is needed on the server

    hashtag
    6- Database Server ( MariaDB) :

    MariaDB open source relational database management system (DBMS) that is a compatible drop-in replacement for the widely used MySQL database technology. MariaDB sports faster and safer replication with updates being up to 2x faster than with traditional MySQL Replication setups. ... MariaDB replication is backward compatible with MySQL servers,

    ZiSoft Awareness Application Architecture
    Master : ZiSoft Awareness Installation Script

    hashtag
    Master + Demo : ZiSoft Awareness with { Demo Data } Installation Script

    hashtag
    Branch : ZiSoft Awareness Installation Script From Branch

    hashtag
    Branch + Demo : ZiSoft Awareness with { Demo Data } Installation Script From Branch

    hashtag
    Install MariaDB Server on Ubuntu 18.04.

    hashtag
    Install MariaDB

    Install the MySQL server by using the Ubuntu package manager:

    The installer installs MySQL and all dependencies.

    If the secure installation utility does not launch automatically after the installation completes, enter the following command:

    This utility prompts you to define the mysql root password and other security-related options, including removing remote access to the root user and setting the root password.

    hashtag
    Allow remote access

    If you have iptables enabled and want to connect to the MySQL database from another machine, you must open a port in your server’s firewall (the default port is 3306). You don’t need to do this if the application that uses MySQL is running on the same server.

    Run the following command to allow remote access to the mysql server:

    hashtag
    Start the MySQL service

    After the installation is complete, you can start the database service by running the following command. If the service is already started, a message informs you that the service is already running:

    hashtag
    Launch at reboot

    To ensure that the database server launches after a reboot, run the following command:

    hashtag
    Configure interfaces

    MySQL, by default is no longer bound to ( listening on ) any remotely accessible interfaces. Edit the “bind-address” directive in /etc/mysql/mysql.conf.d/mysqld.cnf:

    Restart the mysql service.

    hashtag
    Start the mysql shell

    There is more than one way to work with a MySQL server, but this article focuses on the most basic and compatible approach, the mysql shell.

    1. At the command prompt, run the following command to launch the mysql shell and enter it as the root user:

    2. When you’re prompted for a password, enter the one that you set at installation time, or if you haven’t set one, press Enter to submit no password.

      The following mysql shell prompt should appear:

    hashtag
    Set the root password

    If you logged in by entering a blank password, or if you want to change the root password that you set, you can create or change the password.

    1. For versions earlier than MySQL 5.7, enter the following command in the mysql shell, replace password with your new password:

      For version MySQL 5.7 and later, enter the following command in the mysql shell, replacing password with your new password:

    2. To make the change take effect, reload the stored user information with the following command:

      Note: We’re using all-caps for SQL commands. If you type those commands in lowercase, they’ll work. By convention, the commands are written in all-caps to make them stand out from field names and other data that’s being manipulated.

    If you need to reset the root password later, see Reset a MySQL root passwordarrow-up-right.

    hashtag
    View users

    MySQL stores the user information in its own database. The name of the database is mysql. Inside that database the user information is in a table, a dataset, named user. If you want to see what users are set up in the MySQL user table, run the following command:

    The following list describes the parts of that command:

    • SELECT tells MySQL that you are asking for data.

    • User, Host, authentication_string tells MySQL what fields you want it to look in. Fields are categories for the data in a table. In this case, you are looking for the username, the host associated with the username, and the encrypted password entry.

    • FROM mysql.user “ tells MySQL to get the data from the mysql database and the user table.

    • A semicolon (;) ends the command.

    Note: All SQL queries end in a semicolon. MySQL does not process a query until you type a semicolon.

    User hosts

    The following example is the output for the preceding query:

    Users are associated with a host, specifically, the host from which they connect. The root user in this example is defined for localhost, for the IP address of localhost, and the hostname of the server. You usually need to set a user for only one host, the one from which you typically connect.

    If you’re running your application on the same computer as the MySQL server, the host that it connects to by default is localhost. Any new users that you create must have localhost in their host field.

    If your application connects remotely, the host entry that MySQL looks for is the IP address or DNS hostname of the remote computer (the one from which the client is coming).

    Anonymous users

    In the example output, one entry has a host value but no username or password. That’s an anonymous user. When a client connects with no username specified, it’s trying to connect as an anonymous user.

    You usually don’t want any anonymous users, but some MySQL installations include one by default. If you see one, you should either delete the user (refer to the username with empty quotes, like ‘ ‘) or set a password for it.

    hashtag
    Create a database

    There is a difference between a database server and a database, even though those terms are often used interchangeably. MySQL is a database server, meaning it tracks databases and controls access to them. The database stores the data, and it is the database that applications are trying to access when they interact with MySQL.

    Some applications create a database as part of their setup process, but others require you to create a database yourself and tell the application about it.

    To create a database, log in to the mysql shell and run the following command, replacing demodb with the name of the database that you want to create:

    After the database is created, you can verify its creation by running a query to list all databases. The following example shows the query and example output:

    hashtag
    Add a database user

    When applications connect to the database using the root user, they usually have more privileges than they need. You can add users that applications can use to connect to the new database. In the following example, a user named demouser is created.

    1. To create a new user, run the following command in the mysql shell:

    2. When you make changes to the user table in the mysql database, tell MySQL to read the changes by flushing the privileges, as follows:

    3. Verify that the user was created by running a SELECT query again:

    hashtag
    Grant database user permissions

    Right after you create a new user, it has no privileges. The user can log in, but can’t be used to make any database changes.

    1. Give the user full permissions for your new database by running the following command:

    2. Flush the privileges to make the change official by running the following command:

    3. To verify that those privileges are set, run the following command:

      MySQL returns the commands needed to reproduce that user’s permissions if you were to rebuild the server. USAGE on \*.\* means the users gets no privileges on anything by default. That command is overridden by the second command, which is the grant you ran for the new database.

    hashtag
    Configure MySQL server on Ubuntu

    hashtag
    Config files

    By default you’ll find MySQL’s configuration files in:

    If they’re not there, however, you can ask mysqld where it looks for its config. Run the command:

    You’ll get a flood of text back. The first part describes the options you can send to the server when you launch it. The second part is all the configuration stuff that was set when the server was compiled.

    What we’re looking for shows up near the start of the output. Find a couple lines that look like:

    And there we are. The server works down that list until it finds a configuration file.

    hashtag
    my.cnf

    With the location in hand, open the my.cnf file and have a look inside.

    Any lines starting with “#” are comments, and they mostly document what the different settings are for. They’re good to read through. You’ll find details like the location of log files and where the database files are kept.

    Config groups

    There are lines in the config file that just contain a word in square brackets, like “[client]” or “[mysqld]”. Those are “config groups” and they tell the programs that read the configuration file which parts they should pay attention to.

    See, while we’ve been focusing on the server part of MySQL, it’s technically a collection of tools. That includes the server (mysqld), the client (mysql), and some other tools we’ll talk about in a bit. Those programs look in my.cnf to see how they should behave.

    There’s a bit more to it, but basically: The “client” config section controls the mysql client, and the “mysqld” section controls the server config.

    hashtag
    Log files

    If something does go wrong the best place to start troubleshooting any program is its logs. By default MySQL stores its log files in the directory:

    You may need to use sudo to get a listing of the files in that directory.

    If you don’t find the MySQL logs in the default directory you’ll need to check MySQL’s config. Look in the my.cnf file and look for a “log_error” line, as in:

    If you don’t see a line like that, create one in the “mysqld” section so MySQL will use its own error log. We recommend using the location in the example, creating the “/var/log/mysql” directory if it doesn’t already exist. Then restart MySQL to make the change.

    Make sure the log directory you choose can be written to by the user controlling the MySQL process (usually “mysql”). The user running the process will be defined in the “user” config value for mysqld in my.cnf.

    hashtag
    Network settings

    There might be a “port” setting under both the client and server config sections. The port under the server section controls what port the server will listen to. By default that’s 3306 but you can change it to anything you’d like.

    The port in the client section tells the client what port to connect to by default. You’ll generally want the two port settings to match up.

    If you don’t see the port entries in the config file that just means they’re using the default. If you want to change the port you would add the lines in the appropriate categories:

    The other network setting to look for is the “bind-address” value. That usually gets set to the address for localhost, 127.0.0.1. By binding to localhost the server makes sure no one can connect to it from outside the local machine.

    If you’re running your MySQL server on a different machine from your application you’ll want to bind to a remotely-accessible address instead of localhost. Change the bind-address setting to match your public IP address (or, better, a backend IP address on a network that fewer machines can access).

    If you don’t see a “bind-address” entry you should put one into the “mysqld” category to help control access to the server:

    Remember to account for the client’s hostname when you set up your database users and to poke a hole in your firewall if you’re running iptables.

    hashtag
    mysqld and mysqld_safe

    Behind the scenes there are actually two versions of the MySQL server, “mysqld” and “mysqld_safe”. Both read the same config sections. The main difference is that mysqld_safe launches with a few more safety features enabled to make it easier to recover from a crash or other problem.

    Both mysqld and mysqld_safe will read config entries in the “mysqld” section. If you include a “mysqld_safe” section, then only mysqld_safe will read those values in.

    By default the mysql service launches “mysqld_safe”. That’s a good thing, and you should only look to change that if you really know what you’re doing.

    hashtag
    mysqladmin

    The mysqladmin tool lets you perform some administrative functions from the command line. We won’t talk much about it here because we’re just trying to get you up and running with enough basics to get by. It’s worth looking at the tool in more depth later to see what it can do, particularly if you need to build scripts that perform functions like checking the status of the server or creating and dropping databases.

    hashtag
    Backups

    You have a few options when it comes to making backups of your databases apart from the usual “back up the whole machine” approach. The main two are copying the database files and using mysqldump.

    File copy

    By default MySQL creates a directory for each database in its data directory:

    Once you’ve found the data directory, hold off a moment before making a copy of it. When the database server is active it could be writing new values to tables at any time. That means if it writes to a table halfway through your copy some files will change and lead to a corrupt backup. Not a good thing if you’re trying to plan for disaster recovery.

    To make sure the database files are copied cleanly you can shut the MySQL server down entirely before the copy. That’s safe but isn’t always ideal.

    Another approach you can take is to lock the database as read-only for the duration of the copy. Then when you’re done, release the lock. That way your applications can still read data while you’re backing up files.

    Lock the databases to read-only by running, from the command line:

    To unlock the database when you’re done, run:

    We’re using a new option with the mysql client, “-e”. That tells the client to run the query in quotes as if we’d entered it in the mysql shell proper.

    Note that if you’re setting these commands up in a script you can put the password in quotes right after “-p” with no space between the two, as in:

    Just make sure you set the permissions on that file to restrict read access. We don’t want just anyone to be able to see that password.

    mysqldump

    Another approach to backing up your database is to use the “mysqldump” tool. Rather than copying the database files directly, mysqldump generates a text file that represents the database. By default the text file contains a list of SQL statements you would use to recreate the database, but you can also export the database in another format like CSV or XML. You can read the man page for mysqldump to see all its options.

    The statements generated by mysqldump go straight to standard output. You’ll want to specify a file to redirect the output to when you run it. For example:

    That command will tell mysqldump to recreate the “demodb” database in SQL statements and to write them to the file “dbbackup.sql”. Note that the username and password options function the same as the mysql client, so you can include the password directly after “-p” in a script.

    Restore from mysqldump

    Restoring a mysqldumped database looks similar to what was used to create it, but we use plain old “mysql” instead of “mysqldump”:

    We also change from a greater-than to a less-than sign. That switches the command from redirecting its output to telling it to read its input from the existing file. That input is sent to the “mysql” command, causing the mysqldumped instructions to recreate the database.

    Note that by default the SQL statements generated would just add to existing database tables, not overwrite them. If you’re restoring a backup over an existing database you should drop the database’s tables first, or drop and recreate the database itself. You can change that behavior by using the “–add-drop-table” option with the command that creates the mysqldump. That causes mysqldump to add a command to the backup files it writes that will drop tables before recreating them.

    hashtag
    Reset a MySQL root password

    The MySQL root password allows the root user to have full access to the MySQL databasearrow-up-right. You must have (Linux) root or (Windows) Administrator access to the Cloud Serverarrow-up-right to reset the MySQL root password.

    circle-exclamation

    Note: The Cloud Server (Linux) root or (Windows) Administrator account password is not the same as the MySQL password. The Cloud Server password allows access to the server. The MySQL root password allows access only to the MySQL database.

    Use the following steps to reset a MySQL root password by using the command line interface.

    hashtag
    Stop the MySQL service

    (Ubuntu and Debian) Run the following command:

    (CentOS, Fedora, and Red Hat Enterprise Linux) Run the following command:

    hashtag
    Start MySQL without a password

    Run the following command. The ampersand (&) at the end of the command is required.

    hashtag
    Connect to MySQL

    Run the following command:

    hashtag
    Set a new MySQL root password

    Run the following command:

    hashtag
    Stop and start the MySQL service

    (Ubuntu and Debian) Run the following commands:

    (CentOS, Fedora, and Red Hat Enterprise Linux) Run the following commands:

    hashtag
    Log in to the database

    Test the new password by logging in to the database.

    Enter your new password when prompted.

    hashtag

    What is the recommended browser to use ZiSoft Awareness

    ZiSoft awareness supports all major browsers (Chrome, IE 11, Firefox, and Safari), but the recommended browser is Chrome.

    hashtag
    Does ZiSoft require any specific operating system or packages to install

    Depends on your deployment method. If you are using "Docker", then the only requirements is the Docker and Docker-Compose. If you are deploying on the OS without Docker, then you have to install more dependencies yourself. Read the installation guide for more info.

    hashtag
    Can ZiSoft be used on mobile web browsers

    Yes, ZiSoft Web interface is "responsive". It will resize and adjust to the size of your smartphone or tablet.

    hashtag
    Does ZiSoft offer a cloud/hosted deployment

    Absolutely, talk to sales@zisoftonline.comenvelope or visit Zisoftarrow-up-right for more info.

    hashtag
    Does ZiSoft Support HA (High Availability) Installation

    Similar to the single deployment, the HA environment distributes the end user load among several web and analytics servers. There is still one single Database and one single background server. The distribution of the front end load can be designed to separate users by region or department, or it can be load balanced among all users in the organization.

    ZiSoft Architecture HA

    hashtag
    Does ZiSoft support Single Sign On or LDAP

    ZiSoft supports both LDAP and single sign on. This means that your users can use their LDAP (e.g. Active Directory) credentials to login, either by typing them in the ZiSoft portal (LDAP) or by being redirected to your Identity provider portal (SSO). Checkout the user guide for more details on how to setup and integrate with LDAP and SSO.

    hashtag
    Does ZiSoft encrypt data

    ZiSoft provides application level encryption only for sensetive data such as passwords. If you need to encrypt everything, consider database level encryption with your DBA.

    hashtag
    How much bandwidth does ZiSoft need

    ZiSoft Awareness is customizable according to your requirements/capabilities. Out of the box, we have 5 different resolutions of each of the included lessons (320, 480, 720, 1080, and 1440). You can choose which resolution to serve based on your campaign size and network capabilities. For example, if your campaign has 1000 employees, and you expect 100 to be concurrently streaming videos at the same time, then resolution 720 will need a server bandwidth of approximately 70 Mbps.

    hashtag
    What are all the requirements needed to run ZiSoft with all its modules

    Infrastructure: You will need a server with at least 8GB of memory and 2Ghz CPU and is capable of virtualization.

    Operating System: Any of the following

    • Windows 10 Pro or later

    • Linux Centos 7 or later

    • Linux Ubuntu 18 or later

    Global System Settings:

    1. Host Name: The url where the system will be deployed. Example https://zisoft.mycompany.com/apparrow-up-right

    2. Company Name: Example, My Company Inc.

    LDAP Settings: This is needed if you will beimporting users from LDAP (Active Directory) instead of creating users manually

    1. Title

    2. Host

    3. Port

    4. Bind DN

    5. Base DN

    6. Query Filter

    7. User Name Field

    8. First Name Field

    9. Last Name Field

    10. Email Field

    11. Department Field

    12. Group Base DN

    13. Group Search Filter

    14. Group Name Field

    15. Group Member Field

    16. Bind Password

    Email Server Settings: If you will be sending training invitation Emails or Phishing Emails

    1. Title

    2. Host

    3. Port

    4. Security (TLS/SSL)

    5. Username

    6. Auth (Anonymous/Authentication)

    7. Password

    8. From (Email Format)

    9. Reply (Email Format)

    Email Templates: This describes the Emails that you want to send to your employees in various occasions like invitation to campaigns and end-of-campaign certificates. ZiSoft comes packed with sample templates you can use, but if you need to define your own, you will need the following for each template

    1. Title

    2. Content: HTML (You can use the embedded editor in ZiSoft)

    3. Subject

    4. Language: EN/AR

    5. Type: Phishing/General/Training

    These are the set of tools which are required in order to complete any build of the Metabase code. Follow the links to download and install them on your own before continuing.
    1. Oracle JDK 8 (http://www.oracle.com/technetwork/java/javase/downloads/index.html)arrow-up-right

    2. Node.js (http://nodejs.org/)arrow-up-right

    3. Yarn package manager for Node.jsarrow-up-right

    If you are developing on Windows, make sure to use Ubuntu on Windows and follow instructions for Ubuntu/Linux instead of installing ordinary Windows versions.

    hashtag
    Build Metabase

    The entire Metabase application is compiled and assembled into a single .jar file which can run on any modern JVM. There is a script which will execute all steps in the process and output the final artifact for you.

    After running the build script simply look in target/uberjar for the output .jar file and you are ready to go.

    hashtag
    Building Metabase.app

    See this guidearrow-up-right.

    hashtag
    Build Dashboard

    So, you’ve gotten Metabase up and runningarrow-up-right and connected it to your dataarrow-up-right. It’s time to give you the lay of the land.

    hashtag
    The home page

    The home page

    Fresh out of the box, Metabase will show you a few things on the home page:

    • Some automatic explorationsarrow-up-right of your tables that you can look at and save as a dashboard if you like any of them.

    • An area where things you or your teammates create will show up, along with a link to see all the dashboards, questions, and pulses you have.

    • A list of the databases you’ve connected to Metabase.

    Our data

    Once you’ve created some dashboardsarrow-up-right, any of them that you pin in the main “Our analytics” collection will show up on the homepage for all of your teammates, so that when they log in to Metabase they’ll know right where to go.

    hashtag
    Browse your data

    Browse data

    If you connected your database to Metabase during setup, you’ll see it listed at the bottom of the homepage along with the sample dataset that Metabase comes with. Click on a database to see its contents. You can click on a table to see its rows, or you can also click on the bolt icon to x-ray a table and see an automatic exploration of it, or click on the book icon to go to the data reference view for that table to learn more about it.

    hashtag
    Explore your analytics

    As you and your team create dashboards and collections, they’ll start to show up on the homepage. Click on a collection in the “Our analytics” section to see its contents, or click “browse all items” to see everything you and your team have made. More about exploringarrow-up-right

    hashtag
    Ask a question or write a query

    Click the Ask a question button in the top-right of Metabase to start a new simple exploration of one of your tables, ask a more detailed custom question using the notebook editor, or write a new SQL query if you want to really dig in.

    hashtag
    Make a new dashboard or pulse

    In Metabase, dashboards are made up of saved questions that you can arrange and resize as you please. They’re a great way to track important metrics and stats that you care about. Pulses are what regularly scheduled reports are called in Metabase. They can be sent out either via email, Slack, or both.

    To make a dashboard or pulse, click the plus (+) icon in the top-right of the main navigation bar.

    Create menu

    hashtag
    Use search to quickly find things

    Search results

    The search bar that’s always present at the top of the screen lets you search through your tables, dashboards, collections, saved questions, metrics, segments, and pulses in an instant. Just type part of the title of the thing you’re looking for and hit enter. You can activate the search bar from anywhere by pressing the / key.

    hashtag
    Development Environment

    If you plan to work on the Metabase code and make changes then you’ll need to understand a few more things.

    hashtag
    Overview

    The Metabase application has two basic compnents:

    1. a backend written in Clojure which contains a REST API as well as all the relevant code for talking to databases and processing queries.

    2. a frontend written as a Javascript single-page application which provides the web UI.

    Both components are built and assembled together into a single jar file which runs the entire application.

    hashtag
    3rd party dependencies

    Metabase depends on lots of other 3rd party libraries to run, so as you are developing you’ll need to keep those up to date. Leiningen will automatically fetch Clojure dependencies when needed, but for JavaScript dependencies you’ll need to kick off the installation process manually when needed.

    hashtag
    Development server (quick start)

    Run your backend development server with

    Start the frontend build process with

    hashtag
    Frontend development

    We use these technologies for our FE build process to allow us to use modules, es6 syntax, and css variables.

    • webpack

    • babel

    • cssnext

    Frontend tasks are executed using yarn. All available tasks can be found in package.json under scripts.

    To build the frontend client without watching for changes, you can use:

    If you’re working on the frontend directly, you’ll most likely want to reload changes on save, and in the case of React components, do so while maintaining state. To start a build with hot reloading, use:

    Note that at this time if you change CSS variables, those changes will only be picked up when a build is restarted.

    There is also an option to reload changes on save without hot reloading if you prefer that.

    Some systems may have trouble detecting changes to frontend files. You can enable filesystem polling by uncommenting the watchOptions clause in webpack.config.js. If you do this it may be worth making git ignore changes to webpack config, using git update-index --assume-unchanged webpack.config.js

    hashtag
    Frontend testing

    All frontend tests are located in frontend/test directory. Run all frontend tests with

    which will run unit, end-to-end, and legacy Karma browser tests in sequence.

    hashtag
    End-to-end tests

    End-to-end tests simulate realistic sequences of user interactions. They render a complete DOM tree using Enzymearrow-up-right and use temporary backend instances for executing API calls.

    End-to-end tests use an enforced file naming convention <test-suite-name>.e2e.spec.js to separate them from unit tests.

    Useful commands:

    The way integration tests are written is a little unconventional so here is an example that hopefully helps in getting up to speed:

    You can also skim through __support__/e2e.jsarrow-up-right and __support__/enzyme.jsarrow-up-right to see all available methods.

    hashtag
    Jest unit tests

    Unit tests are focused around isolated parts of business logic.

    Unit tests use an enforced file naming convention <test-suite-name>.unit.spec.js to separate them from end-to-end and integration tests.

    hashtag
    Karma browser tests

    If you need to test code which uses browser APIs that are only available in real browsers, you can add a Karma test to frontend/test/legacy-karma directory.

    hashtag
    Backend development

    Leiningen and your REPL are the main development tools for the backend. There are some directions below on how to setup your REPL for easier development.

    And of course your Jetty development server is available via

    To automatically load backend namespaces when files are changed, you can instead run with

    lein ring server takes significantly longer to launch than lein run, so if you aren’t working on backend code we’d recommend sticking to launching with lein run.

    hashtag
    Building drivers

    Most of the drivers Metabase uses to connect to external data warehouse databases are separate Leiningen projects under the modules/ subdirectory. When running Metabase via lein, you’ll need to build these drivers in order to have access to them. You can build drivers as follows:

    (or)

    The first time you build a driver, it will be a bit slow, because Metabase needs to build the core project a couple of times so the driver can use it as a dependency; you can take comfort in the fact that you won’t need to build the driver again after that. Alternatively, running Metabase 1.0+ from the uberjar will unpack all of the pre-built drivers into your plugins directory; you can do this instead if you already have a Metabase uberjar (just make sure plugins is in the root directory of the Metabase source, i.e. the same directory as project.clj).

    hashtag
    Including driver source paths for development or other Leiningen tasks

    For development when running various Leiningen tasks you can add the include-all-drivers profile to merge the drivers’ dependencies and source paths into the Metabase project:

    This profile is added by default when running lein repl, tests, and linters.

    Unit Tests / Linting

    Run unit tests with

    or a specific test with

    By default, the tests only run against the h2 driver. You can specify which drivers to run tests against with the env var DRIVERS:

    Some drivers require additional environment variables when testing since they are impossible to run locally (such as Redshift and Bigquery). The tests will fail on launch and let you know what parameters to supply if needed.

    Run the linters:

    Developing with Emacs

    .dir-locals.el contains some Emacs Lisp that tells clojure-mode how to indent Metabase macros and which arguments are docstrings. Whenever this file is updated, Emacs will ask you if the code is safe to load. You can answer ! to save it as safe.

    By default, Emacs will insert this code as a customization at the bottom of your init.el. You’ll probably want to tell Emacs to store customizations in a different file. Add the following to your init.el:

    hashtag
    Documentation

    Instant Cheatsheet

    Start up an instant cheatsheet for the project + dependencies by running

    hashtag
    Internationalization

    We are an application with lots of users all over the world. To help them use Metabase in their own language, we mark all of our strings as i18n.

    hashtag
    Adding new strings:

    If you need to add new strings (try to be judicious about adding copy) do the following:

    1. Tag strings in the frontend using t and jt ES6 template literals (see more details in https://ttag.js.org/):

    and in the backend using trs and related macros (see more details in https://github.com/puppetlabs/clj-i18n):

    hashtag
    Translation errors or missing strings

    If you see incorrect or missing strings for your langauge, please visit our POEditor projectarrow-up-right and submit your fixes there.

    Zinadarrow-up-right

    SaaS :Kubeapps

    Software-as-a-Service (SaaS) offers a compelling opportunity for developers who create software originally intended to run at web scale. Having a single code base that runs a variety of enterprise-level business applications reduces the labor that goes into creating and maintaining the software that supports it all. The promise of "one code base to rule them all" makes developing SaaS platforms a value proposition that's hard to ignore—as long as the development team has the expertise to make their ideas real. You need to know a thing or two about creating SaaS platforms. They are a bit of a different beast than single-purpose web applications.

    There are two ways to create a SaaS platform. One is the "greenfield" approach: Build a SaaS platform from scratch. The other way is to transform an existing web application into a SaaS platform.

    This article takes a look at the second way. I describe how to transform an existing web application into a SaaS platform with the help of a concrete, yet fictitious, business named Clyde's Clarinets. The goal of the article is to describe how to transform Clyde's Clarinets into a SaaS platform named Instrument Resellers.

    hashtag
    Understanding the example business scenario

    Clyde's Clarinets is a successful business revolving around an application that Clyde developed to streamline his business's operation. The business uses the software to support the workflow of buying used clarinets online, refurbishing them, and finally reselling them at a profit.

    The application has accelerated business growth significantly. As a result, Clyde thinks the software can benefit others too. His plan is to refactor the application into a full-blown SaaS platform.

    Clyde's Clarinets stands in here for many real-world examples where a company builds some software for its own use, realizes the application will be valuable to others, and then transforms the custom application into a SaaS platform they can sell on a subscription basis to other businesses.

    Clyde's Clarinets works as follows:

    1. The application scours the internet looking for used clarinets for sale. The application keeps a list of clarinets identified as candidates for purchase.

    2. The list is presented to an expert human being, who selects clarinets to buy from the list. The application makes the actual purchase and keeps track of purchasing activity. The application also keeps track of refurbishing and resale activities.

    3. When a purchased clarinet is received from the seller, a human declares the instrument as received. After a clarinet is refurbished, a human also marks that task as complete.

    Figure 1 illustrates the process just described.

    Clyde's Clarinets is an attractive business model. There are a lot of clarinet players in the world, and Clyde's Clarinets has made a good business by providing these musicians with high-quality refurbished instruments. In fact, the business model is so good that the developers of Clyde's Clarinets want to expand their enterprise to other instruments and make their system available to other musical instrument resellers as a brand-specific application.

    But presently, the software supports only clarinets under the name Clyde's Clarinets. The question is how to transform the domain-specific clarinet business into one that will support a variety of instruments and a variety of resellers.

    The key is to discover the abstract patterns that are the foundation of the application. If the abstract patterns are generic enough, the application can be expanded to SaaS. If the patterns are too specific, the application will be hard to transform. A SaaS platform can't be everything to everyone, but it also can't be so narrow in scope that it can't scale up to support a lot of customers. Again, the key is understanding the abstract patterns in play to determine whether a generic model exists.

    hashtag
    Looking for the generic patterns

    Clyde's Clarinets is a good candidate for transformation into a SaaS platform because its underlying behavior is generic. Figure 2 reproduces Clyde's Clarinets business model with more generic text.

    Figure 2 is identical to Figure 1 except for one key difference. The subject of the workflow in Figure 1 is a clarinet, while in Figure 2 it can be any instrument. Because substituting the term "instrument" for "clarinet" doesn't clash with the overall intention of the workflow supported by the application, we can deduce that there is indeed a generic pattern in play.

    The existence of the generic pattern means that Clyde's Clarinets is a good candidate for conversion to SaaS. However, two more conditions must be satisfied to enable the conversion. First, Clyde's Clarinets's software needs to separate logic from configuration. Second, the application needs to be hosted in an infrastructure that can support a large number of SaaS customers and their users.

    In the next sections, we'll take a look at the details.

    hashtag
    Separate logic from configuration

    As explained in the previous section, to convert Clyde's Clarinets to a SaaS platform, the application's logic must be generic. Nothing specifically about a clarinet can be hard coded into the software or into the application's underlying data model. Specifics should be controlled by the configuration.

    Moving specificity into the configuration might seem like a straightforward undertaking, but sometimes specificity can be baked into software in the most insidious of ways. Two of the usual culprits are non-generic data models and hard-coded strings that are specific to the business domain. Let's examine each condition.

    At first glance, the data model might seem like a generic description of a musical instrument, but it's not. Note that the instrumentType property is an enum of type InstrumentType that lists only three possible values: A, B-flat, and bass. Limiting the InstrumentType values violates the generic intention. Why? Only a few instruments have those particular types. There is no such thing as a B-flat flute or a B-flat oboe. Thus, the data model could never be used to sell flutes or oboes.

    Granted, this constraint is not knowledge a lay programmer might have. But the first time a user tries to define a flute on the Clyde's Clarinets SaaS platform (now renamed Instrument Resellers) the shortcoming will become glaringly apparent. It's a significant issue and one that needs to be addressed before the SaaS can be exposed to the public.

    Non-generic data models can be a real showstopper when converting a web application to a SaaS platform. Many times they're not obvious. Thus, when considering a conversion, make sure to set aside enough time to conduct a detailed analysis of the web application's data structures and refactor non-generic ones into generic versions.

    hashtag
    Beware of strings hard coded to the business domain

    Inappropriate specificity goes beyond data models. It can also appear within the intent of the application itself. Keep in mind that presently the web application is specifically about Clyde's Clarinets. There might be any number of references to the name Clyde's Clarinets in the application's web pages. Transforming the web app into a suitable SaaS platform usable by a number of resellers probably requires some changes to the code.

    There are two approaches that a developer can take to make the change. One is to dedicate a unique copy of the source code to each reseller. Before that code is released, a developer executes a search and replace on the instance of the code base dedicated to the reseller to substitute the reseller's name throughout the application—for example replacing each occurrence of "Clyde's Clarinets" with "Gloria's Guitars."

    This is by no means an optimal approach. Duplicating instances and then making changes in those instances is risky. The copy and paste approach violates the Don't Repeat Yourself (DRY) rule, an essential principle of good software design. Eventually, so many special copies of the application will be released into production that maintenance will become an ongoing nightmare.

    The better alternative is to maintain a generic code base for application logic and declare application specifics in configuration files or a database. Separating specifics from generic behavior helps support a variety of business domains, but is also useful for larger concerns such as serving an international user base. For example, hard coding an application to display text only in English excludes it from general-purpose use in regions such as Asia and South America. It's more versatile to put such information in a database and bind the localized terms to the UI according to a locale defined in the software.

    The takeaway is this: A well designed SaaS platform, whether built from scratch or refactored from an existing web application, separates logic from configuration to the finest grain of detail.

    hashtag
    Identify a computing environment that can scale as the service grows

    SaaS platforms require a higher degree of versatility and scalability than a single-purpose web application usually requires. To watch this evolution, suppose that Clyde's Clarinets starts out running on a single application server that uses a dedicated database server (Figure 3). This is quite conceivable for a small company serving a musical clientele.

    As Clyde's Clarinets grows, the team needs to add a load balancer along with duplicate application servers and database instances, all of which run on either bare metal or virtual machines (VMs) to handle increased traffic (Figure 4).

    hashtag
    The role of containers

    Once the Clyde's Clarinets web application is converted to the Instrument Resellers SaaS, manually adding machines and servers pushes the limits of human capability. Many companies try to address the scaling problem by converting all machines to VMs and then automating the VM provisioning process.

    But this approach has its limits too. VMs are slow to spin up. Slowly provisioning a VM can be tolerable when running a single web application, but when you have a SaaS platform that might support hundreds of companies and each company is supporting tens of thousands of users, scaling up using only VMs is unacceptable. The scaling is just too slow. Therefore, the modern solution uses (Figure 5) on an orchestration platform such as .

    A container relies on the host operating system to implement isolation at the process, memory, and file system levels. The encapsulation provided by containers makes it possible to run dozens, maybe hundreds of containers on a single physical or virtual machine in a controlled manner, depending on how the host is configured.

    A significant benefit of using containers is that they load very fast—an order of magnitude faster than VMs. Thus, container technology is well suited to applications that need to scale up and down according to current traffic demands.

    hashtag
    The role of Kubernetes

    For container technology to be useful in an automated manner at web scale, some sort of orchestration platform is needed. Just as with virtual machines, it doesn't make any sense to base container deployment on manual provisioning.

    This is where the Kubernetes container orchestration technology comes into play. Kubernetes solves many of the problems that go with running applications and services on containers at web scale. The tradeoff is that Kubernetes is complex in terms of both environment configuration and physical hosting.

    To refactor a web application such as Clyde's Clarinets into a set of Kubernetes containers and services could require some work. And then, once the work is done, the resulting application needs to be provisioned into a Kubernetes cluster. That Kubernetes cluster needs to be deployed to a set of virtual machines or, depending on the needs of the company running the SaaS application, a set of bare metal computers.

    hashtag
    Scalable hosting

    A single-instance application such as Clyde's Clarinets can be hosted on a Kubernetes cluster made up of a small number of virtual machines hosted in a private data center, or spun up and running on a cloud provider such as .

    However, spinning up a SaaS platform such as Instruments Reseller manually on a Kubernetes cluster, and hosting it on a few VMs, doesn't suffice. It's just too much work for a human to do. Something more is needed: A cloud-native Kubernetes hosting solution such as . Cloud-native platforms are intended to run at massive web scale in an automated manner.

    The benefit of using a cloud-native provider to host SaaS is that you can focus on doing the work that goes into designing, maintaining, and improving the SaaS. Developers in this scenario don't need to do most of the work that goes with maintaining the SaaS at scale. They don't have to pay a lot of attention to the number of running VMs, scaling containers up or down to support the current load on the cluster, or addressing environmental issues. SaaS developers focus on the logic and configuration of the software, while the cloud native providers focus on the Kubernetes infrastructure (Figure 6).

    Whether you decide to use OpenShift or another container platform, the important thing to understand about computing environments is that just converting code from a single instance web application to a SaaS platform is not the only work that goes into the SaaS transformation process. A computing environment that can support the SaaS at web scale matters a lot.

    Putting SaaS on a cloud provider and container platform that can scale dynamically and seamlessly according to the service's needs provides significantly more value than just ensuring that the environment can meet expected nominal demand. Also, while scaling up to meet record high levels of demand is important, so is scaling down to minimize cost at times that customers are not using the application.

    Remember, a SaaS product is intended to be used by a large number of companies and their users. Where it runs is just as important as how it runs. Determining the computing environment is an important decision.

    hashtag
    Architecture, configurability, and hosting are all important

    Software-as-a-Service continues to grow in popularity. Applications such as word processors and spreadsheets that used to be installed and run directly on the computer are now SaaS applications that run in a web browser. The same is true of more complex services such as video conferencing and even video editing.

    SaaS platforms that are intended for tens of thousands or even millions of users are the future of software architecture. This model offers efficiency and opportunity. But along with such benefits comes complexity. Luckily, a good deal of the operational complexity created by SaaS can be delegated to a cloud native provider that specializes in hosting SaaS platforms.

    Still, consideration needs to be given to the SaaS architecture. It's essential in SaaS design to separate logic from configuration down to the deepest levels, from data structures to localization terms.

    The key to making SaaS platforms work is versatility. An application that separates logic and configuration in a fine-grained manner is more versatile than those in which hardcoding is inextricably embedded in the software.

    Not every web application can be transformed into a SaaS platform. Some are just too specific to the business domain. But web applications whose underlying patterns are generic to a variety of businesses are good candidates for conversion.

    Then it's a question of doing the refactoring work to make the generic patterns useful to a variety of customers. Once the code has been transformed, the last piece of work is to identify a reliable, resilient hosting infrastructure that can scale the SaaS platform up or down depending on the traffic demands.

    Linux Commands

    Full linux Commands https://www.golinuxcloud.com/linux-commands-cheat-sheet/arrow-up-right

    The commands under this section are very basic commands and must be known to every system administrator. This is definitely not the complete list of Linux commands for file management but can give you a kickstart and can cover most of the basic to complex scenarios.

    hashtag
    1. System Based Commands

    hashtag
    2. Hardware Based Commands

    hashtag
    3. Users Management Commands

    hashtag
    4. File Commands

    hashtag
    5. Process Related Commands

    hashtag
    6. File Permission Commands

    hashtag
    7. Network Commands

    hashtag
    8. Compression/Archives Commands

    hashtag
    9. Install Packages Commands

    hashtag
    10. Install Source (Compilation)

    hashtag
    11. Search Commands

    hashtag
    12. Login Commands

    hashtag
    13. File Transfer Commands

    hashtag
    14. Disk Usage Commands

    hashtag
    15. Directory Traverse Commands

    Linux Directory Structure

    In Linux/Unix operating system everything is a file even directories are files, files are files, and devices like mouse, keyboard, printer, etc are also files. Here we are going to see the Directory S

    hashtag
    Types of files in the Linux system.

    1. General Files – It is also called ordinary files. It may be an image, video, program, or simple text files. These types of files can be in ASCII or Binary format. It is the most commonly used file in the Linux system.

    2. Directory Files – These types of files are a warehouse for other file types. It may be a directory file within a directory (subdirectory).

    3. Device Files – In a Windows-like operating system, devices like CD-ROM, and hard drives are represented as drive letters like F: G: H whereas in the Linux system device are represented as files. As for example, /dev/sda1, /dev/sda2 and so on

    hashtag
    These are the common top-level directories associated with the root directory:

    • /bin – binary or executable programs.

    • /etc – system configuration files.

    • /home – home directory. It is the default current directory.

    hashtag
    Some other directories in the Linux system:

    • /boot- It contains all the boot-related information files and folders such as conf, grub, etc.

    • /dev – It is the location of the device files such as dev/sda1, dev/sda2, etc.

    • /lib – It contains kernel modules and a shared library.

    hashtag
    Exploring directories and their usability:

    We know that Linux is a very complex system that requires an efficient way to start, stop, maintain and reboot a system, unlike Windows operating system. In the Linux system some well-defined configuration files, binaries, man pages information files available for every process.

    Linux Kernel File:

    • /boot/vmlinux – The Linux kernel file.

    Device Files:

    • /dev/hda – Device file for the first IDE HDD.

    • /dev/hdc – A pseudo-device that output garbage output is redirected to /dev/null.

    System Configuration Files:

    • /etc/bashrc – It is used by bash shell that contains system defaults and aliases.

    • /etc/crontab – A shell script to run specified commands on a predefined time interval.

    • /etc/exports – It contains information on the file system available on the network.

    User Related Files:

    • /usr/bin – It contains most of the executable files.

    • /usr/bin/X11 – Symbolic link of /usr/bin.

    • /usr/include – It contains standard include files used by C program.

    Virtual and Pseudo Process Related Files:

    • /proc/cpuinfo – CPU Information

    • /proc/filesystems – It keeps the useful info about the processes that are running currently.

    • /proc/interrupts – it keeps the information about the number of interrupts per IRQ.

    Version Information File:

    • /version – It displays the Linux version information.

    Log Files:

    • /var/log/lastlog – It stores user last login info.

    • /var/log/messages – It has all the global system messages.

    • /var/log/wtmp – It keeps a history of login and logout information.

    Kubernetes Production Deployment

    hashtag
    A- Building Kubernetes cluster

    • Install Kubeadm Cluster

    • Install Network DaemonSet

    • Install Dashboard

    • Install Rook.io ( ceph )Storage

    hashtag
    Install Kubeadm Cluster

    hashtag
    Install Master :

    circle-info

    After installation finish Copy join Token

    hashtag
    Install Nodes :

    circle-info

    Paste Cluster join Token that Copied from Master Installation

    hashtag
    Install Network Daemon-Set

    hashtag

    hashtag
    Check Kubernetes Cluster [ CoreDNS / Network /Nodes ]

    Check cluster-info

    Check Nodes Status

    Check Cluster ( DNS / Network /Controller / Scheduler / Proxy / API-server / ETCD)

    Running & Ready by Command

    hashtag
    Install Rook.io ( Ceph ) Storage

    Ceph Storage

    Ceph is a highly scalable distributed storage solution for block storage, object storage, and shared file systems with years of production deployments.

    Design

    Rook enables Ceph storage systems to run on Kubernetes using Kubernetes primitives. The following image illustrates how Ceph Rook integrates with Kubernetes.

    With Ceph running in the Kubernetes cluster, Kubernetes applications can mount block devices and filesystems managed by Rook, or can use the S3/Swift API for object storage. The Rook operator automates configuration of storage components and monitors the cluster to ensure the storage remains available and healthy.

    The Rook operator is a simple container that has all that is needed to bootstrap and monitor the storage cluster. The operator will start and monitor , the Ceph OSD daemons to provide RADOS storage, as well as start and manage other Ceph daemons. The operator manages CRDs for pools, object stores (S3/Swift), and file systems by initializing the pods and other artifacts necessary to run the services.

    The operator will monitor the storage daemons to ensure the cluster is healthy. Ceph mons will be started or failed over when necessary, and other adjustments are made as the cluster grows or shrinks. The operator will also watch for desired state changes requested by the api service and apply the changes.

    The Rook operator also initializes the agents that are needed for consuming the storage. Rook automatically configures the Ceph-CSI driver to mount the storage to your pods. Rook’s flex driver is still also configured automatically, though will soon be deprecated in favor of the CSI driver.

    The rook/ceph image includes all necessary tools to manage the cluster – there are no changes to the data path. Rook does not attempt to maintain full fidelity with Ceph. Many of the Ceph concepts like placement groups and crush maps are hidden so you don’t have to worry about them. Instead Rook creates a much simplified UX for admins that is in terms of physical resources, pools, volumes, filesystems, and buckets. At the same time, advanced configuration can be applied when needed with the Ceph tools.

    Rook is implemented in golang. Ceph is implemented in C++ where the data path is highly optimized. We believe this combination offers the best of both worlds.

    Clone Rook Repository

    Check Rook-ceph Running and ready

    Check Ceph HEATH

    hashtag
    Install Dashboard

    A Kubernetes dashboard is a web-based Kubernetes user interface which is used to deploy containerized applications to a Kubernetes cluster, troubleshoot the applications, and manage the cluster itself along with its attendant resources.

    Uses of Kubernetes Dashboard

    • To get an overview of applications running on your cluster.

    • To create or modify the individual Kubernetes resources for example Deployments, Jobs, etc.

    • It provides the information on the state of Kubernetes resources in your cluster, and on any errors that may have occurred.

    Accessing Dashboard

    Get Access Token

    Home Page You’ll see the home/welcome page in which you can view which system applications Running

    hashtag
    Licenses : Zisoft Awareness Application Generate Licenses

    Licenses Arguments : "client- Name , date, users, phishing_end_date, phishing_users"

    Git Flow / Git Branching Model

    Git flow is the set of guidelines that developers can follow when using Git. We cannot say these guidelines as rules. These are not the rules; it is a standard for an ideal project. So that a developer would easily understand the things.

    It is referred to as Branching Model by the developers and works as a central repository for a project. Developers work and push their work to different branches of the main repository.

    There are different types of branches in a project. According to the standard branching strategy and release management, there can be following types of branches:

    Every branch has its meaning and standard. Let's understand each branch and its usage.

    Two of the branching model's branches are considered as main branches of the project. These branches are as follows:

    The master branch is the main branch of the project that contains all the history of final changes. Every developer must be used to the master branch. The master branch contains the source code of HEAD that always reflects a final version of the project.

    Your local repository has its master branch that always up to date with the master of a remote repository.

    It is suggested not to mess with the master. If you edited the master branch of a group project, your changes would affect everyone else, and very quickly, there will be merge conflicts.

    It is parallel to the master branch. It is also considered as the main branch of the project. This branch contains the latest delivered development changes for the next release. It has the final source code for the release. It is also called as a "integration branch."

    When the develop branch reaches a stable point and is ready to release, it should be merged with master and tagged with a release version.

    The development model needs a variety of supporting branches for the parallel development, tracking of features, assist in quick fixing and release, and other problems. These branches have a limited lifetime and are removed after the uses.

    The different types of supportive branches, we may use are as follows:

    Each of these branches is made for a specific purpose and have some merge targets. These branches are significant for a technical perspective.

    Feature branches can be considered as topic branches. It is used to develop a new feature for the next version of the project. The existence of this branch is limited; it is deleted after its feature has been merged with develop branch.

    To learn how to create a Feature Branch

    .

    The release branch is created for the support of a new version release. Senior developers will create a release branch. The release branch will contain the predetermined amount of the feature branch. The release branch should be deployed to a staging server for testing.

    Developers are allowed for minor bug fixing and preparing meta-data for a release on this branch. After all these tasks, it can be merged with the develop branch.

    When all the targeted features are created, then it can be merged with the develop branch. Some usual standard of the release branch are as follows:

    • Generally, senior developers will create a release branch.

    • The release branch will contain the predetermined amount of the feature branch.

    • The release branch should be deployed to a staging server for testing.

    To tag branch after merging the release branch, Visit

    .

    Hotfix branches are similar to Release branches; both are created for a new production release.

    The hotfix branches arise due to immediate action on the project. In case of a critical bug in a production version, a hotfix branch may branch off in your project. After fixing the bug, this branch can be merged with the master branch with a tag.

    Architecture of Linux system

    The Linux operating system's architecture mainly contains some of the components: the Kernel, System Library, Hardware layer, System, and Shell utility.

    Linux Architecture

    1. Kernel:- The kernel is one of the core section of an operating system. It is responsible for each of the major actions of the Linux OS. This operating system contains distinct types of modules and cooperates with underlying hardware directly. The kernel facilitates required abstraction for hiding details of low-level hardware or application programs to the system. There are some of the important kernel types which are mentioned below:

    • Monolithic Kernel

    • Micro kernels

    • Exo kernels

    • Hybrid kernels

    2. System Libraries:- These libraries can be specified as some special functions. These are applied for implementing the operating system's functionality and don't need code access rights of the modules of kernel.

    3. System Utility Programs:- It is responsible for doing specialized level and individual activities.

    4. Hardware layer:- Linux operating system contains a hardware layer that consists of several peripheral devices like CPU, HDD, and RAM.

    5. Shell:- It is an interface among the kernel and user. It can afford the services of kernel. It can take commands through the user and runs the functions of the kernel. The shell is available in distinct types of OSes. These operating systems are categorized into two different types, which are the graphical shells and command-line shells.

    The graphical line shells facilitate the graphical user interface, while the command line shells facilitate the command line interface. Thus, both of these shells implement operations. However, the graphical user interface shells work slower as compared to the command-line interface shells.

    There are a few types of these shells which are categorized as follows:

    • Korn shell

    • Bourne shell

    • C shell

    SeMA Deployment Architecture

    hashtag
    SeMA Logical deployment architecture

    Odoo follows a multi-tier architecture, and we can identify three main tiers: Data, Logic, and Presentation:

    Odoo logical Architecture

    The Data tier is the lowest-level layer, and is responsible for data storage and persistence. Odoo relies on a PostgreSQL server for this. PostgreSQL is the only supported RDBMS, and this is a design choice. So, other databases such as MySQL are not supported. Binary files, such as attachments of documents or images, are usually stored in a filesystem.

    The Logic tier is responsible for all the interactions with the data layer, and is handled by the Odoo server. As a general rule, the low-level database should only be accessed by this layer, since it is the only way to ensure security access control and data consistency. At the core of the Odoo server, we have the Object-Relational Mapping (ORM) engine for this interface. The ORM provides the application programming interface (API) used by the addon modules to interact with the data.

    The Presentation tier is responsible for presenting data and interacting with the user. It is implemented by a client responsible for all the user experience. The client interacts with the ORM API to read, write, verify, or perform any other action, calling ORM API methods through remote procedure calls (RPCs). These are sent to the Odoo server for processing, and then the results are sent back to the client for further handling.

    Ingress Controller: NGINX is web serving, reverse proxying, caching, load balancing, media streaming, and more. It started out as a web server designed for maximum performance and stability. In addition to its HTTP server capabilities, NGINX can also function as a proxy server for email (IMAP, POP3, and SMTP) and a reverse proxy and load balancer for HTTP, TCP, and UDP servers Redis Server: Redis , is a fast, open source, in-memory, key-value data store , All Redis data resides in memory, which enables low latency and high throughput data access. Unlike traditional databases, In-memory data stores don’t require a trip to disk, reducing engine latency to microseconds. Because of this, in-memory data stores can support an order of magnitude more operations and faster response times. The result is blazing-fast performance with average read and write operations taking less than a millisecond and support for millions of operations per second. BI Tool [ MetaBase - SuperSet ]: Business intelligence (BI) tools are types of application software which collect and process large amounts of unstructured data from internal and external systems, including books, journals, documents, health records, images, files, email, video and other business sources

    hashtag
    SeMA physical Deployment Architecture

    Sizing for performance and load requirements is an iterative process that estimates the number of CPUs and corresponding memory required to support the services in the deployed system. When estimating the number of CPUs required to support a service, consider the following:

    • Use cases and corresponding usage analysis that apply to the service

    • System requirements determined during analysis for technical requirements

    • Past experience with the Odoo System components providing the service

    The process of sizing for performance typically consists of the following steps. The ordering of these steps is not critical—it simply provides a way to consider the factors that affect the final result.

    1. Determine a baseline CPU estimate for components identified as user entry points to the system.

    2. Make adjustments to the CPU estimates to account for dependencies between components.

    3. Make adjustments to the CPU estimates to reflect security, availability, scalability, and latent capacity requirements.

    Larvel application sizing-estimation process .

    Shown below is a diagram of sizing-estimation process. It is not the only method for sizing deployment, but it should provide useful insight and guidance

    1. Estimate user concurrency and throughput

    In most use-case scenarios, the number of expected concurrent users is far less than the number of named users of system. A scenario in which all of the named users are simultaneously accessing the system is extremely rare. Normally, a globally distributed organization with users spread out all over the world experience about ⅓ of its named users online at any time during their individual 8-hour work days.

    Concurrency typically ranges from 10% to 50+% for App deployments.

    2. Estimate SeMA Application HW sizing

    circle-check

    A- Every CPU core handles 2 Worker B- Worker can handle 120 Portal users C- Concurrent user = Users use app simultaneously with time session 5 sec D - Best practice of workers per machine from 17 to 33 [Due to processor queuing]

    3. Estimate SeMA DB HW sizing Database storage requirements may be estimated roughly using the following calculation:

    circle-check

    4. Estimate SeMA File Storage HW sizing

    circle-info

    hashtag
    SeMA App file storage can start with 4 TB and extend based on monitoring actual usage of storage

    GIT

    Git is an open-source distributed version control system. It is designed to handle minor to major projects with high speed and efficiency. It is developed to co-ordinate the work among the developers. The version control allows us to track and work together with our team members at the same workspace.

    Git is foundation of many services like GitHub and GitLab, but we can use Git without using any other Git services. Git can be used privately and publicly.

    Git was created by Linus Torvalds in 2005 to develop Linux Kernel. It is also used as an important distributed version-control tool for the DevOps.

    Git is easy to learn, and has fast performance. It is superior to other SCM tools like Subversion, CVS, Perforce, and ClearCase.

    Some remarkable features of Git are as follows:

    • Open Source Git is an open-source tool. It is released under the GPL (General Public License) license.

    • Scalable Git is scalable, which means when the number of users increases, the Git can easily handle such situations.

    • Distributed One of Git's great features is that it is

    • Security Git is secure. It uses the SHA1 (Secure Hash Function) to name and identify objects within its repository. Files and commits are checked and retrieved by its checksum at the time of checkout. It stores its history in such a way that the ID of particular commits depends upon the complete development history leading up to that commit. Once it is published, one cannot make changes to its old version.

    • Speed Git is very fast, so it can complete all the tasks in a while. Most of the git operations are done on the local repository, so it provides a huge speed. Also, a centralized version control system continually communicates with a server somewhere. Performance tests conducted by Mozilla showed that it was extremely fast compared to other VCSs. Fetching version history from a locally stored repository is much faster than fetching it from the remote server. The core part of Git is written in C, which

    • Another feature of Git that makes it apart from other SCM tools is that it is possible to quickly stage some of our files and commit them without committing other modified files in our working directory.

    • Maintain the clean history Git facilitates with Git Rebase; It is one of the most helpful features of Git. It fetches the latest commits from the master branch and puts our code on top of that. Thus, it maintains a clean history of the project.

    A version control application allows us to keep track of all the changes that we make in the files of our project. Every time we make changes in files of an existing project, we can push those changes to a repository. Other developers are allowed to pull your changes from the repository and continue to work with the updates that you added to the project files.

    Some significant benefits of using Git are as follows:

    ​

    ​

    • Saves Time Git is lightning fast technology. Each command takes only a few seconds to execute so we can save a lot of time as compared to login to a GitHub account and find out its features.

    • Offline Working One of the most important benefits of Git is that it supports offline working. If we are facing internet connectivity issues, it will not affect our work. In Git, we can do almost everything locally. Comparatively, other CVS like SVN is limited and prefer the connection with the central repository.

    We have discussed many features and benefits of Git that demonstrate the undoubtedly Git as the leading version control system. Now, we will discuss some other points about why should we choose Git.

    • Git Integrity Git is developed to ensure the security and integrity of content being version controlled. It uses checksum during transit or tampering with the file system to confirm that information is not lost. Internally it creates a checksum value from the contents of the file and then verifies it when transmitting or storing data.

    • Trendy Version Control System Git is the most widely used version control system. It has maximum projects among all the version control systems. Due to its amazing workflow and features, it is a preferred choice of developers.

    Linux labs

    hashtag
    Lab 1: Create Instance. with linux OS

    hashtag
    Lab 2 : Install Nginx service

    hashtag
    Lab 3 : Install Own Cloud server

    hashtag
    lab 4 : Take Cron backup from mariadb and storage dir

    Git Version Control System

    A version control system is a software that tracks changes to a file or set of files over time so that you can recall specific versions later. It also allows you to work together with other programmers.

    The version control system is a collection of software tools that help a team to manage changes in a source code. It uses a special kind of database to keep track of every modification to the code.

    Developers can compare earlier versions of the code with an older version to fix the mistakes.

    hashtag
    Benefits of the Version Control System

    Git Commands

    Here is a list of most essential Git commands that are used daily.

    Let's understand each command in detail.

    This command configures the user. The Git config command is the first and necessary command used on the Git command line. This command sets the author name and email address to be used with your commits. Git config is also used in other scenarios.

    $ git config --global user.name "ImDwivedi1"

    This command is used to create a local repository.

    The init command will initialize an empty repository. See the below screenshot.

    Dear {last_name}, You have been invited to campaign {campaign_name}
    Dear john, You have been invited to campaign "First Quarter Password Awareness"
    macOS: $HOME/.composer/vendor/bin
    Linux OS: $HOME/.config/composer/vendor/bin
    composer global require "laravel/installer"
    laravel new nirectory_name
    composer create-project laravel/laravel - prefer -dist
    php artisan serve
    php artisan key: generate
    APP_ENV = local
    APP_DEBUG = true
    APP_KEY = base64:ZPt2wmKE/X4eEhrzJU6XX4R93rCwYG8E2f8QUA7kGK8 =
    APP_URL = http://localhost
    DB_CONNECTION = mysql
    DB_HOST = 127.0.0.1
    DB_PORT = 3306
    DB_DATABASE = homestead
    DB_USERNAME = homestead
    DB_PASSWORD = secret
    CACHE_DRIVER = file
    SESSION_DRIVER = file
    QUEUE_DRIVER = sync
    REDIS_HOST = 127.0.0.1
    REDIS_PASSWORD = null
    REDIS_PORT = 6379
    MAIL_DRIVER = smtp
    MAIL_HOST = mailtrap.ioMAIL_PORT = 2525
    MAIL_USERNAME = null
    MAIL_PASSWORD = null
    MAIL_ENCRYPTION = null
    php artisan down
    php artisan up
    apt update 
    apt install npm -y
    npm install -g @angular/cli
    ng new my-project-name
    ng build --prod
    Copyfunction helloWorld() {
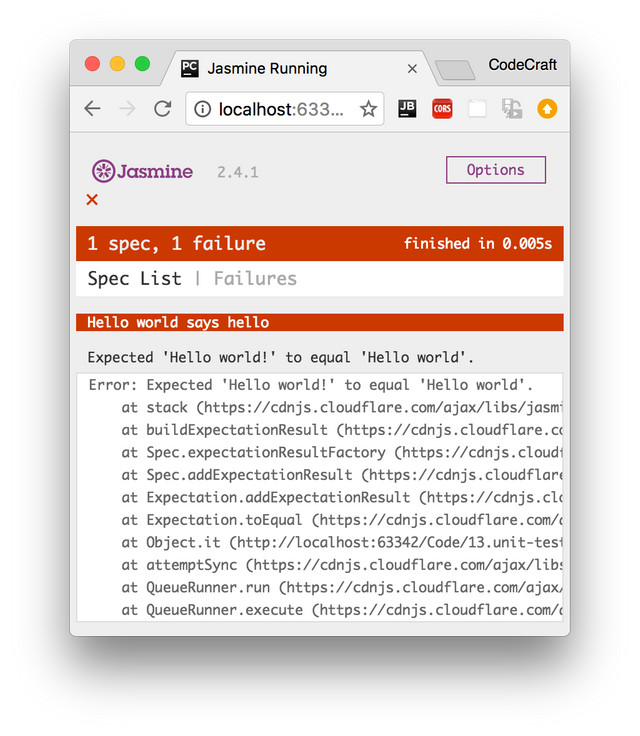
      return 'Hello world!';
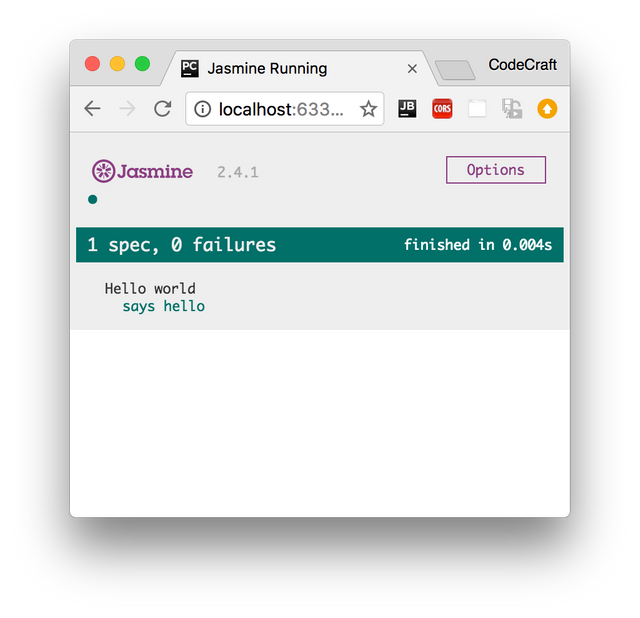
    }
    Copydescribe('Hello world', () => { (1)
      it('says hello', () => { (2)
        expect(helloWorld()) (3)
            .toEqual('Hello world!'); (4)
      });
    });
    Copyexpect(array).toContain(member);
    expect(fn).toThrow(string);
    expect(fn).toThrowError(string);
    expect(instance).toBe(instance);
    expect(mixed).toBeDefined();
    expect(mixed).toBeFalsy();
    expect(mixed).toBeNull();
    expect(mixed).toBeTruthy();
    expect(mixed).toBeUndefined();
    expect(mixed).toEqual(mixed);
    expect(mixed).toMatch(pattern);
    expect(number).toBeCloseTo(number, decimalPlaces);
    expect(number).toBeGreaterThan(number);
    expect(number).toBeLessThan(number);
    expect(number).toBeNaN();
    expect(spy).toHaveBeenCalled();
    expect(spy).toHaveBeenCalledTimes(number);
    expect(spy).toHaveBeenCalledWith(...arguments);
    Copydescribe('Hello world', () => {
    
      let expected = "";
    
      beforeEach(() => {
        expected = "Hello World";
      });
    
      afterEach(() => {
        expected = "";
      });
    
      it('says hello', () => {
        expect(helloWorld())
            .toEqual(expected);
      });
    });
    Copy<link rel="stylesheet" href="jasmine.css">
    <script src="jasmine.js"></script>
    <script src="jasmine-html.js"></script>
    <script src="boot.js"></script>
    Copy<link rel="stylesheet" href="jasmine.css">
    <script src="jasmine.js"></script>
    <script src="jasmine-html.js"></script>
    <script src="boot.js"></script>
    
    <script src="main.js"></script>
    Copy<link rel="stylesheet" href="jasmine.css">
    <script src="jasmine.js"></script>
    <script src="jasmine-html.js"></script>
    <script src="boot.js"></script>
    
    <script src="main.js"></script>
    
    <script src="test.js"></script>
    $theme: (
      font-main: unquote('"Segoe UI", Roboto, "Helvetica Neue", Arial, sans-serif'),
      font-secondary: font-main,
    
      font-weight-thin: 200,
      font-weight-light: 300,
      font-weight-normal: 400,
      font-weight-bolder: 500,
      font-weight-bold: 600,
      font-weight-ultra-bold: 800,
    
      base-font-size: 16px,
    
      font-size-xlg: 1.25rem,
      font-size-lg: 1.125rem,
      font-size: 1rem,
      font-size-sm: 0.875rem,
      font-size-xs: 0.75rem,
    
      radius: 0.375rem,
      padding: 1.25rem,
      margin: 1.5rem,
      line-height: 1.25,
    
      ...
    $theme: (
      font-main: unquote('"Segoe UI", Roboto, "Helvetica Neue", Arial, sans-serif'),
      font-secondary: font-main,
      ...
    
      header-font-family: font-secondary,
      header-font-size: font-size,
      header-line-height: line-height,
      header-fg: color-fg-heading,
      header-bg: color-bg,
      header-height: 4.75rem,
      header-padding: 1.25rem,
      header-shadow: shadow,
    
      ...
    @import '../../../@theme/styles/themes';
    
    :host {
    
      background: nb-theme(card-bg); // and use it
    }
    @import '../../../@theme/styles/themes';
    
    @include nb-install-component() {
      background: nb-theme(card-bg); // now, for each theme registered the corresponding value will be inserted
    
      .container {
        background: nb-theme(color-bg);
        font-weight: nb-theme(font-weight-bold);
      }
    }
    {
      "/api": {
        "target": "http://localhost:3000",
        "secure": false
      }
    }
    ng serve --proxy-config proxy.conf.json
    server {
      listen 80;
      server_name website.com;
    
      root /yourAngularAppDistPath;
      index index.html index.htm;
      etag on;
    
      location / {
        index index.html;
        try_files $uri /index.html;
      }
    }
    server {
      listen 80;
      server_name website.com;
    
      root /yourAngularAppDistPath;
      index index.html index.htm;
      etag on;
    
      location / {
        index index.html;
        try_files $uri /index.html;
      }
    
      location /api {
        proxy_pass http://localhost:3000/;
        proxy_set_header Host $host;
      }
    }
    wget  https://raw.githubusercontent.com/omarabdalhamid/zisoft-scripts/master/zisoft-master.sh  &&  sh zisoft-master.sh
    #!/bin/bash
    ################################################################################
    # Script for installing ZiSoft on Ubuntu 14.04, 15.04, 16.04 and 18.04 (could be used for other version too)
    # Author: OmarAbdalhamid Omar
    #-------------------------------------------------------------------------------
    # This script will install ZiSoft Awareness 3 on your Ubuntu 18.04 server. I
    #-------------------------------------------------------------------------------
    # Make a new file:
    # sudo nano zisoft-install.sh
    # Place this content in it and then make the file executable:
    # sudo chmod +x zisoft-install.sh
    # Execute the script to install zisoft:
    # ./zisoft-install.sh
    ################################################################################
    
    
    #--------------------------------------------------
    # Clone ZiSoft Awareness Repo
    #--------------------------------------------------
    
    echo "\n#############################################"
    
    echo "\n--- Clone ZiSoft branch --"
    
    echo "\n#############################################"
    
    
    sudo mkdir zisoft-test
    cd  zisoft-test
    sudo git clone https://gitlab.com/zisoft/awareness.git


    #--------------------------------------------------
    # Update Server
    #--------------------------------------------------
    
    
    echo "\n#############################################"
    
    echo  "\n--- Download Docker Repositry --"
    
    
    echo "\n#############################################"
    
    sudo apt-get update -y
    sudo apt install npm -y
    sudo apt-get install \
        apt-transport-https \
        ca-certificates \
        curl \
        software-properties-common -y
    
    sudo curl -fsSL https://download.docker.com/linux/ubuntu/gpg | sudo apt-key add -
    
    sudo add-apt-repository \
       "deb [arch=amd64] https://download.docker.com/linux/ubuntu \
       $(lsb_release -cs) \
       stable"
    
    sudo apt install gnupg2 pass -y
    sudo add-apt-repository universe -y
    sudo apt-get update -y
    
    #--------------------------------------------------
    # Install Docker & Docker Swarm
    #--------------------------------------------------
    
    sudo apt-get install docker-ce -y
    
    sudo apt-get install docker-compose -y
    
    sudo usermod -aG docker ${USER}
    
    sudo docker login registry.gitlab.com
    sudo docker swarm init
    
    #--------------------------------------------------
    # Run npm Package of ZiSoft CLI
    #--------------------------------------------------
    
    echo "\n#############################################"
    
    echo  "\n--- Download NPM Packages --"
    
    echo "\n#############################################"
    
    
    cd awareness/cli
    sudo npm update
    sudo npm link
    cd ..
    
    #--------------------------------------------------
    # Build && Package  ZiSoft Awareness Project
    #--------------------------------------------------
    
    echo "\n#############################################"
    
    echo "\n--- Build ZiSoft APP--"
    
    
    echo "\n#############################################"
    
    
    sudo zisoft build --docker --sass --app --ui --composer
    
    echo -e "\n--- Package ZiSoft APP--"
    
    
    sudo zisoft package
    
    
    #--------------------------------------------------
    # Deploy  ZiSoft Awareness Project
    #--------------------------------------------------
    
    echo "\n#############################################"
    
    
    echo  "\n--- Deploy ZiSoft APP--"
    
    
    echo "\n#############################################"
    
    sudo zisoft deploy --prod
    
    sleep 3m
    
    container_web_id="$(sudo docker ps | grep zisoft/awareness/web | awk '{print $1}')"
    
    container_ui_id="$(sudo docker ps | grep zisoft/awareness/ui | awk '{print $1}')"


    sudo docker exec -it $container_web_id bash -c 'sed -i "/zinad:lessons/a '\''campaign1'\'' => 1"  app/Console/Commands/Demo.php'
    
    sudo docker exec -it $container_web_id bash -c 'sed -i "/zinad:lessons/a '\''mode'\'' => '\''none'\'',"  app/Console/Commands/Demo.php'
    
    sudo docker exec -it $container_web_id bash -c 'sed -i "/zinad:lessons/a '\''resolution'\'' => '\''720'\'',"  app/Console/Commands/Demo.php'
    
    sudo docker exec -it $container_web_id bash -c 'sed -i "/zinad:lessons/a '\''version'\'' => 1,"  app/Console/Commands/Demo.php'
    
    
    sudo docker exec -it $container_web_id bash -c "php artisan db:seed --class=init"
    
    sudo docker exec -it $container_web_id bash -c "php artisan zinad:lesson browser 1 720 prod"
    
    sudo docker exec -it $container_web_id bash -c "php artisan zinad:lesson email 1 720 prod"
    
    sudo docker exec -it $container_web_id bash -c "php artisan zinad:lesson password 1 720 prod"
    
    sudo docker exec -it $container_web_id bash -c "php artisan zinad:lesson social 1 720 prod"
    
    sudo docker exec -it $container_web_id bash -c "php artisan zinad:lesson wifi 1 720 prod"
    
    sudo docker exec -it $container_web_id bash -c "php artisan zinad:lesson aml 1 720 prod"


    sudo docker exec -it $container_web_id bash -c "php artisan db:seed --class=DropRecreateDB"
    
    
    sudo docker exec -it $container_web_id bash -c "php artisan migrate"
    
    
    sudo docker exec -it $container_web_id bash -c "php artisan db:seed --class=init"
    
    
    sudo docker exec -it $container_web_id bash -c "php artisan zisoft:demo 100 5 30"
    
    sudo docker restart $container_ui_id
    
    
    #--------------------------------------------------
    #  ZiSoft Awareness Project  Installed Successfully 
    #--------------------------------------------------
    
    echo "\n#############################################"
    
    
    echo "\n-----ZiSoft Awareness Project  Installed Successfully ----"
    
    
    echo "\n#############################################"
    wget  https://raw.githubusercontent.com/omarabdalhamid/zisoft-scripts/master/zisoft-master--demo.sh   &&  sh zisoft-master--demo.sh
    #!/bin/bash
    ################################################################################
    # Script for installing ZiSoft on Ubuntu 14.04, 15.04, 16.04 and 18.04 (could be used for other version too)
    # Author: OmarAbdalhamid Omar
    #-------------------------------------------------------------------------------
    # This script will install ZiSoft Awareness 3 on your Ubuntu 18.04 server. I
    #-------------------------------------------------------------------------------
    # Make a new file:
    # sudo nano zisoft-install.sh
    # Place this content in it and then make the file executable:
    # sudo chmod +x zisoft-install.sh
    # Execute the script to install zisoft:
    # ./zisoft-install.sh
    ################################################################################


    #--------------------------------------------------
    # Clone ZiSoft Awareness Repo
    #--------------------------------------------------
    
    echo "\n#############################################"
    
    echo "\n--- Clone ZiSoft branch --"
    
    echo "\n#############################################"
    
    
    sudo mkdir zisoft-test
    cd  zisoft-test
    sudo git clone https://gitlab.com/zisoft/awareness.git


    #--------------------------------------------------
    # Update Server
    #--------------------------------------------------
    
    
    echo "\n#############################################"
    
    echo  "\n--- Download Docker Repositry --"
    
    
    echo "\n#############################################"
    
    sudo apt-get update -y
    sudo apt install npm -y
    sudo apt-get install \
        apt-transport-https \
        ca-certificates \
        curl \
        software-properties-common -y
    
    sudo curl -fsSL https://download.docker.com/linux/ubuntu/gpg | sudo apt-key add -
    
    sudo add-apt-repository \
       "deb [arch=amd64] https://download.docker.com/linux/ubuntu \
       $(lsb_release -cs) \
       stable"
    
    sudo apt install gnupg2 pass -y
    sudo add-apt-repository universe -y
    sudo apt-get update -y
    
    #--------------------------------------------------
    # Install Docker & Docker Swarm
    #--------------------------------------------------
    
    sudo apt-get install docker-ce -y
    
    sudo apt-get install docker-compose -y
    
    sudo usermod -aG docker ${USER}
    
    sudo docker login registry.gitlab.com
    sudo docker swarm init
    
    #--------------------------------------------------
    # Run npm Package of ZiSoft CLI
    #--------------------------------------------------
    
    echo "\n#############################################"
    
    echo  "\n--- Download NPM Packages --"
    
    echo "\n#############################################"
    
    
    cd awareness/cli
    sudo npm update
    sudo npm link
    cd ..
    
    #--------------------------------------------------
    # Build && Package  ZiSoft Awareness Project
    #--------------------------------------------------
    
    echo "\n#############################################"
    
    echo "\n--- Build ZiSoft APP--"
    
    
    echo "\n#############################################"
    
    
    sudo zisoft build --docker --sass --app --ui --composer
    
    echo -e "\n--- Package ZiSoft APP--"
    
    
    sudo zisoft package
    
    
    #--------------------------------------------------
    # Deploy  ZiSoft Awareness Project
    #--------------------------------------------------
    
    echo "\n#############################################"
    
    
    echo  "\n--- Deploy ZiSoft APP--"
    
    
    echo "\n#############################################"
    
    sudo zisoft deploy --prod
    
    sleep 3m
    
    container_web_id="$(sudo docker ps | grep zisoft/awareness/web | awk '{print $1}')"
    
    container_ui_id="$(sudo docker ps | grep zisoft/awareness/ui | awk '{print $1}')"


    sudo docker exec -it $container_web_id bash -c 'sed -i "/zinad:lessons/a '\''campaign1'\'' => 1"  app/Console/Commands/Demo.php'
    
    sudo docker exec -it $container_web_id bash -c 'sed -i "/zinad:lessons/a '\''mode'\'' => '\''none'\'',"  app/Console/Commands/Demo.php'
    
    sudo docker exec -it $container_web_id bash -c 'sed -i "/zinad:lessons/a '\''resolution'\'' => '\''720'\'',"  app/Console/Commands/Demo.php'
    
    sudo docker exec -it $container_web_id bash -c 'sed -i "/zinad:lessons/a '\''version'\'' => 1,"  app/Console/Commands/Demo.php'
    
    
    sudo docker exec -it $container_web_id bash -c "php artisan db:seed --class=init"
    
    sudo docker exec -it $container_web_id bash -c "php artisan zinad:lesson browser 1 720 prod"
    
    sudo docker exec -it $container_web_id bash -c "php artisan zinad:lesson email 1 720 prod"
    
    sudo docker exec -it $container_web_id bash -c "php artisan zinad:lesson password 1 720 prod"
    
    sudo docker exec -it $container_web_id bash -c "php artisan zinad:lesson social 1 720 prod"
    
    sudo docker exec -it $container_web_id bash -c "php artisan zinad:lesson wifi 1 720 prod"
    
    sudo docker exec -it $container_web_id bash -c "php artisan zinad:lesson aml 1 720 prod"
    
    sudo docker exec -it $container_web_id bash -c "php artisan zinad:lessons 720 1 720 prod"
    
    
    sudo docker exec -it $container_web_id bash -c "php artisan db:seed --class=DropRecreateDB"
    
    
    sudo docker exec -it $container_web_id bash -c "php artisan migrate"
    
    
    sudo docker exec -it $container_web_id bash -c "php artisan db:seed --class=init"
    
    
    sudo docker exec -it $container_web_id bash -c "php artisan zisoft:demo 100 5 30"
    
    sudo docker restart $container_ui_id
    
    curl -L https://downloads.portainer.io/portainer-agent-stack.yml -o portainer-agent-stack.yml
    
    sudo docker stack deploy --compose-file=portainer-agent-stack.yml portainer
    
    #--------------------------------------------------
    #  ZiSoft Awareness Project  Installed Successfully 
    #--------------------------------------------------
    
    echo "\n#############################################"
    
    
    echo "\n-----ZiSoft Awareness Project  Installed Successfully ----"
    
    
    echo "\n#############################################"
    
    wget  https://raw.githubusercontent.com/omarabdalhamid/zisoft-scripts/master/zisoft-branch.sh  && sh  zisoft-branch.sh
    #!/bin/bash
    ################################################################################
    # Script for installing ZiSoft on Ubuntu 14.04, 15.04, 16.04 and 18.04 (could be used for other version too)
    # Author: OmarAbdalhamid Omar
    #-------------------------------------------------------------------------------
    # This script will install ZiSoft Awareness 3 on your Ubuntu 18.04 server. I
    #-------------------------------------------------------------------------------
    # Make a new file:
    # sudo nano zisoft-branch.sh
    # Place this content in it and then make the file executable:
    # sudo chmod +x zisoft-install.sh
    # Execute the script to install zisoft:
    # ./zisoft-branch.sh
    ################################################################################
    
    echo "\n#############################################"
    
    echo  "\n--- Installing ZiSoft From Branch --"
    
    echo "\n#############################################"
    
    read -p "Enter ZiSoft Awareness  Branch Name :   "  release_date
    
    
    #--------------------------------------------------
    # Clone ZiSoft Awareness Repo
    #--------------------------------------------------
    
    echo "\n#############################################"
    
    echo "\n--- Clone ZiSoft branch --"
    
    echo "\n#############################################"
    
    
    sudo mkdir zisoft-test
    cd  zisoft-test
    sudo git clone https://gitlab.com/zisoft/awareness.git --branch $release_date


    #--------------------------------------------------
    # Update Server
    #--------------------------------------------------
    
    
    echo "\n#############################################"
    
    echo  "\n--- Download Docker Repositry --"
    
    
    echo "\n#############################################"
    
    sudo apt-get update -y
    sudo apt install npm -y
    sudo apt-get install \
        apt-transport-https \
        ca-certificates \
        curl \
        software-properties-common -y
    
    sudo curl -fsSL https://download.docker.com/linux/ubuntu/gpg | sudo apt-key add -
    
    sudo add-apt-repository \
       "deb [arch=amd64] https://download.docker.com/linux/ubuntu \
       $(lsb_release -cs) \
       stable"
    
    sudo apt install gnupg2 pass -y
    sudo add-apt-repository universe -y
    sudo apt-get update -y
    
    #--------------------------------------------------
    # Install Docker & Docker Swarm
    #--------------------------------------------------
    
    sudo apt-get install docker-ce -y
    
    sudo apt-get install docker-compose -y
    
    sudo usermod -aG docker ${USER}
    
    sudo docker login registry.gitlab.com
    sudo docker swarm init
    
    #--------------------------------------------------
    # Run npm Package of ZiSoft CLI
    #--------------------------------------------------
    
    echo "\n#############################################"
    
    echo  "\n--- Download NPM Packages --"
    
    echo "\n#############################################"
    
    
    cd awareness/cli
    sudo npm update
    sudo npm link
    cd ..
    
    #--------------------------------------------------
    # Build && Package  ZiSoft Awareness Project
    #--------------------------------------------------
    
    echo "\n#############################################"
    
    echo "\n--- Build ZiSoft APP--"
    
    
    echo "\n#############################################"
    
    
    sudo zisoft build --docker --sass --app --ui --composer
    
    echo -e "\n--- Package ZiSoft APP--"
    
    
    sudo zisoft package
    
    
    #--------------------------------------------------
    # Deploy  ZiSoft Awareness Project
    #--------------------------------------------------
    
    echo "\n#############################################"
    
    
    echo  "\n--- Deploy ZiSoft APP--"
    
    
    echo "\n#############################################"
    
    sudo zisoft deploy --prod
    
    sleep 3m
    
    container_web_id="$(sudo docker ps | grep zisoft/awareness/web | awk '{print $1}')"
    
    container_ui_id="$(sudo docker ps | grep zisoft/awareness/ui | awk '{print $1}')"
    
    sudo docker exec -it $container_web_id bash -c "php artisan db:seed --class=init"
    
    sudo docker restart $container_ui_id
    
    
    #--------------------------------------------------
    #  ZiSoft Awareness Project  Installed Successfully 
    #--------------------------------------------------
    
    echo "\n#############################################"
    
    
    echo "\n-----ZiSoft Awareness Project  Installed Successfully ----"
    
    
    echo "\n#############################################"
    wget  https://raw.githubusercontent.com/omarabdalhamid/zisoft-scripts/master/zisoft-branch-demo.sh  &&  sh zisoft-branch-demo.sh 
    #!/bin/bash
    ################################################################################
    # Script for installing ZiSoft on Ubuntu 14.04, 15.04, 16.04 and 18.04 (could be used for other version too)
    # Author: OmarAbdalhamid Omar
    #-------------------------------------------------------------------------------
    # This script will install ZiSoft Awareness 3 on your Ubuntu 18.04 server. I
    #-------------------------------------------------------------------------------
    # Make a new file:
    # sudo nano zisoft-install.sh
    # Place this content in it and then make the file executable:
    # sudo chmod +x zisoft-install.sh
    # Execute the script to install zisoft:
    # ./zisoft-install.sh
    ################################################################################
    
    echo "\n#############################################"
    
    echo  "\n--- Installing ZiSoft From Branch --"
    
    echo "\n#############################################"
    
    read -p "Enter ZiSoft Awareness  Branch Name :   "  release_date
    
    
    #--------------------------------------------------
    # Clone ZiSoft Awareness Repo
    #--------------------------------------------------
    
    echo "\n#############################################"
    
    echo "\n--- Clone ZiSoft branch --"
    
    echo "\n#############################################"
    
    
    sudo mkdir zisoft-test
    cd  zisoft-test
    sudo git clone https://gitlab.com/zisoft/awareness.git --branch $release_date


    #--------------------------------------------------
    # Update Server
    #--------------------------------------------------
    
    
    echo "\n#############################################"
    
    echo  "\n--- Download Docker Repositry --"
    
    
    echo "\n#############################################"
    
    sudo apt-get update -y
    sudo apt install npm -y
    sudo apt-get install \
        apt-transport-https \
        ca-certificates \
        curl \
        software-properties-common -y
    
    sudo curl -fsSL https://download.docker.com/linux/ubuntu/gpg | sudo apt-key add -
    
    sudo add-apt-repository \
       "deb [arch=amd64] https://download.docker.com/linux/ubuntu \
       $(lsb_release -cs) \
       stable"
    
    sudo apt install gnupg2 pass -y
    sudo add-apt-repository universe -y
    sudo apt-get update -y
    
    #--------------------------------------------------
    # Install Docker & Docker Swarm
    #--------------------------------------------------
    
    sudo apt-get install docker-ce -y
    
    sudo apt-get install docker-compose -y
    
    sudo usermod -aG docker ${USER}
    
    sudo docker login registry.gitlab.com
    sudo docker swarm init
    
    #--------------------------------------------------
    # Run npm Package of ZiSoft CLI
    #--------------------------------------------------
    
    echo "\n#############################################"
    
    echo  "\n--- Download NPM Packages --"
    
    echo "\n#############################################"
    
    
    cd awareness/cli
    sudo npm update
    sudo npm link
    cd ..
    
    #--------------------------------------------------
    # Build && Package  ZiSoft Awareness Project
    #--------------------------------------------------
    
    echo "\n#############################################"
    
    echo "\n--- Build ZiSoft APP--"
    
    
    echo "\n#############################################"
    
    
    sudo zisoft build --docker --sass --app --ui --composer
    
    echo -e "\n--- Package ZiSoft APP--"
    
    
    sudo zisoft package
    
    
    #--------------------------------------------------
    # Deploy  ZiSoft Awareness Project
    #--------------------------------------------------
    
    echo "\n#############################################"
    
    
    echo  "\n--- Deploy ZiSoft APP--"
    
    
    echo "\n#############################################"
    
    sudo zisoft deploy --prod
    
    sleep 3m
    
    container_web_id="$(sudo docker ps | grep zisoft/awareness/web | awk '{print $1}')"
    
    container_ui_id="$(sudo docker ps | grep zisoft/awareness/ui | awk '{print $1}')"


    sudo docker exec -it $container_web_id bash -c 'sed -i "/zinad:lessons/a '\''campaign1'\'' => 1"  app/Console/Commands/Demo.php'
    
    sudo docker exec -it $container_web_id bash -c 'sed -i "/zinad:lessons/a '\''mode'\'' => '\''none'\'',"  app/Console/Commands/Demo.php'
    
    sudo docker exec -it $container_web_id bash -c 'sed -i "/zinad:lessons/a '\''resolution'\'' => '\''720'\'',"  app/Console/Commands/Demo.php'
    
    sudo docker exec -it $container_web_id bash -c 'sed -i "/zinad:lessons/a '\''version'\'' => 1,"  app/Console/Commands/Demo.php'
    
    
    sudo docker exec -it $container_web_id bash -c "php artisan db:seed --class=init"
    
    sudo docker exec -it $container_web_id bash -c "php artisan zinad:lesson browser 1 720 prod"
    
    sudo docker exec -it $container_web_id bash -c "php artisan zinad:lesson email 1 720 prod"
    
    sudo docker exec -it $container_web_id bash -c "php artisan zinad:lesson password 1 720 prod"
    
    sudo docker exec -it $container_web_id bash -c "php artisan zinad:lesson social 1 720 prod"
    
    sudo docker exec -it $container_web_id bash -c "php artisan zinad:lesson wifi 1 720 prod"
    
    sudo docker exec -it $container_web_id bash -c "php artisan zinad:lesson aml 1 720 prod"
    
    sudo docker exec -it $container_web_id bash -c "php artisan zinad:lessons 720 1 720 prod"
    
    
    sudo docker exec -it $container_web_id bash -c "php artisan db:seed --class=DropRecreateDB"
    
    
    sudo docker exec -it $container_web_id bash -c "php artisan migrate"
    
    
    sudo docker exec -it $container_web_id bash -c "php artisan db:seed --class=init"
    
    
    sudo docker exec -it $container_web_id bash -c "php artisan zisoft:demo 100 5 30"
    
    sudo docker restart $container_ui_id
    
    curl -L https://downloads.portainer.io/portainer-agent-stack.yml -o portainer-agent-stack.yml
    
    sudo docker stack deploy --compose-file=portainer-agent-stack.yml portainer
    
    #--------------------------------------------------
    #  ZiSoft Awareness Project  Installed Successfully 
    #--------------------------------------------------
    
    echo "\n#############################################"
    
    
    echo "\n-----ZiSoft Awareness Project  Installed Successfully ----"
    
    
    echo "\n#############################################"
    /usr/bin/mysql -u root -p
    mysql>
    UPDATE mysql.user SET Password = PASSWORD('password') WHERE User = 'root';
    UPDATE mysql.user SET authentication_string = PASSWORD('password') WHERE User = 'root';
    INSERT INTO mysql.user (User,Host,authentication_string,ssl_cipher,x509_issuer,x509_subject)
    VALUES('demouser','localhost',PASSWORD('demopassword'),'','','');
    FLUSH PRIVILEGES;
    SELECT User, Host, authentication_string FROM mysql.user;
    
    +------------------+-----------+-------------------------------------------+
    | User             | Host      | Password                                  |
    +------------------+-----------+-------------------------------------------+
    | root             | localhost | *756FEC25AC0E1823C9838EE1A9A6730A20ACDA21 |
    | mysql.session    | localhost | *THISISNOTAVALIDPASSWORDTHATCANBEUSEDHERE |
    | mysql.sys        | localhost | *THISISNOTAVALIDPASSWORDTHATCANBEUSEDHERE |
    | debian-sys-maint | localhost | *27E7CA2445405AB10C656AFD0F86AF76CCC57692 |
    | demouser         | localhost | *0756A562377EDF6ED3AC45A00B356AAE6D3C6BB6 |
    +------------------+-----------+-------------------------------------------+
    GRANT ALL PRIVILEGES ON demodb.* to demouser@localhost;
    FLUSH PRIVILEGES;
    SHOW GRANTS FOR 'demouser'@'localhost';
    2 rows in set (0.00 sec)
    sudo apt-get update
    sudo apt-get install mariadb-server
    sudo mysql_secure_installation utility
    sudo ufw enable
    sudo ufw allow mysql
    sudo systemctl start mysql
    sudo systemctl enable mysql
    bind-address		= 127.0.0.1 ( The default. )
    bind-address		= XXX.XXX.XXX.XXX ( The ip address of your Public Net interface. )
    bind-address		= ZZZ.ZZZ.ZZZ.ZZZ ( The ip address of your Service Net interface. )
    bind-address		= 0.0.0.0 ( All ip addresses. )
    sudo systemctl restart mysql
    SELECT User, Host, authentication_string FROM mysql.user;
    SELECT User, Host, authentication_string FROM mysql.user;
    +------------------+-----------+-------------------------------------------+
    | User             | Host      | authentication_string                     |
    +------------------+-----------+-------------------------------------------+
    | root             | localhost | *756FEC25AC0E1823C9838EE1A9A6730A20ACDA21 |
    | mysql.session    | localhost | *THISISNOTAVALIDPASSWORDTHATCANBEUSEDHERE |
    | mysql.sys        | localhost | *THISISNOTAVALIDPASSWORDTHATCANBEUSEDHERE |
    | debian-sys-maint | localhost | *27E7CA2445405AB10C656AFD0F86AF76CCC57692 |
    +------------------+-----------+-------------------------------------------+
    CREATE DATABASE demodb;
    SHOW DATABASES;
    +--------------------+
    | Database           |
    +--------------------+
    | information_schema |
    | demodb             |
    | mysql              |
    +--------------------+
    3 rows in set (0.00 sec)
    /etc/mysql
    /usr/sbin/mysqld --help --verbose
    Default options are read from the following files in the given order:
    /etc/my.cnf /etc/mysql/my.cnf /usr/etc/my.cnf ~/.my.cnf
    /etc/mysql/my.cnf
    /var/log/mysql
    log_error = /var/log/mysql/error.log
    [client]
    port = 3306
    
    [mysqld]
    port = 3306
    [mysqld]
    bind-address = 127.0.0.1
    /var/lib/mysql
    mysql -u root -p -e "FLUSH TABLES WITH READ LOCK;"
    mysql -u root -p -e "UNLOCK TABLES;"
    mysql -u root -p"password" -e "FLUSH TABLES WITH READ LOCK;"
    mysql -u root -p"password" -e "UNLOCK TABLES;"
    mysqldump -u root -p demodb > dbbackup.sql
    mysql -u root -p demodb < dbbackup.sql
    sudo /etc/init.d/mysql stop
    sudo /etc/init.d/mysqld stop
    sudo mysqld_safe --skip-grant-tables &
    mysql -uroot
    use mysql;
    
    update user set authentication_string=PASSWORD("mynewpassword") where User='root';
    
    flush privileges;
    
    quit
    sudo /etc/init.d/mysql stop
    ...
    sudo /etc/init.d/mysql start
    sudo /etc/init.d/mysqld stop
    ...
    sudo /etc/init.d/mysqld start
    mysql -u root -p
    ./bin/build
    # javascript dependencies
    $ yarn
    lein ring server
    yarn build-hot
    $ yarn build
    $ yarn build-hot
    $ yarn build-watch
    yarn test
    lein run refresh-integration-test-db-metadata # Scan the sample dataset and re-run sync/classification/field values caching
    yarn test-e2e-watch # Watches for file changes and runs the tests that have changed
    yarn test-e2e-watch TestFileName # Watches the files in paths that match the given (regex) string
    import {
        useSharedAdminLogin,
        createTestStore,
    } from "__support__/e2e";
    import {
        click
    } from "__support__/enzyme"
    
    import { mount } from "enzyme"
    
    import { FETCH_DATABASES } from "metabase/redux/metadata";
    import { INITIALIZE_QB } from "metabase/query_builder/actions";
    import RunButton from "metabase/query_builder/components/RunButton";
    
    describe("Query builder", () => {
        beforeAll(async () => {
            // Usually you want to test stuff where user is already logged in
            // so it is convenient to login before any test case.
            useSharedAdminLogin()
        })
    
        it("should let you run a new query", async () => {
            // Create a superpowered Redux store.
            // Remember `await` here!
            const store = await createTestStore()
    
            // Go to a desired path in the app. This is safest to do before mounting the app.
            store.pushPath('/question')
    
            // Get React container for the whole app and mount it using Enzyme
            const app = mount(store.getAppContainer())
    
            // Usually you want to wait until the page has completely loaded, and our way to do that is to
            // wait until the completion of specified Redux actions. `waitForActions` is also useful for verifying that
            // specific operations are properly executed after user interactions.
            // Remember `await` here!
            await store.waitForActions([FETCH_DATABASES, INITIALIZE_QB])
    
            // You can use `enzymeWrapper.debug()` to see what is the state of DOM tree at the moment
            console.log(app.debug())
    
            // You can use `testStore.debug()` method to see which Redux actions have been dispatched so far.
            // Note that as opposed to Enzyme's debugging method, you don't need to wrap the call to `console.log()`.
            store.debug();
    
            // For simulating user interactions like clicks and input events you should use methods defined
            // in `enzyme.js` as they abstract away some React/Redux complexities.
            click(app.find(RunButton))
    
            // Note: In pretty rare cases where rendering the whole app is problematic or slow, you can just render a single
            // React container instead with `testStore.connectContainer(container)`. In that case you are not able
            // to click links that lead to other router paths.
        });
    })
    yarn test-unit # Run all tests at once
    yarn test-unit-watch # Watch for file changes
    yarn test-karma # Run all tests once
    yarn test-karma-watch # Watch for file changes
    lein run
    lein ring server
    # Build the 'mongo' driver
    ./bin/build-driver.sh mongo
    # Build all drivers
    ./bin/build-drivers.sh
    # Install dependencies
    lein with-profiles +include-all-drivers deps
    lein test
    lein test metabase.api.session-test
    DRIVERS=h2,postgres,mysql,mongo lein test
    lein eastwood && lein bikeshed && lein docstring-checker && lein check-namespace-decls && ./bin/reflection-linter
    (setq custom-file (concat user-emacs-directory ".custom.el")) ; tell Customize to save customizations to ~/.emacs.d/.custom.el
    (ignore-errors                                                ; load customizations from ~/.emacs.d/.custom.el
      (load-file custom-file))
    lein instant-cheatsheet
    const someString = t`Hello ${name}!`;
    const someJSX = <div>{jt`Hello ${name}`}</div>;
    (trs "Hello {0}!" name)

    OWASP WebGoat Demo

  • Introduction to OWASP Top 10

  • SANS Top 25 Threat

  • Recent Attack Trends

  • Web Infrastructure Security/Web Application Firewalls

  • Managing Configurations for Web Apps

  • Lab : using Burp proxy to test web applications

  • Password Management

  • Lab : Password Demo

  • Check Nginx dir structure

  • Step 4: Install MariaDB Database Server

  • After refurbishing is completed, a human makes a photo and a video of the clarinet being played and uploads the media to the application.

  • The application then posts the clarinet information, sale price, photo, and video on a variety of resale websites. The application interacts with the resale sites to discover a buyer and verify payment.

  • Once a clarinet is sold, the Clyde's Clarinets application notifies the company's shipping department to package and send the sold item to the buyer. The shipping department enters the shipping information into the Clyde's Clarinets application.

  • containersarrow-up-right
    Kubernetesarrow-up-right
    IBM Cloudarrow-up-right
    Red Hat OpenShiftarrow-up-right

    /opt – optional or third-party software.

  • /tmp – temporary space, typically cleared on reboot.

  • /usr – User related programs.

  • /var – log files.

  • /lost+found – It is used to find recovered bits of corrupted files.

  • /media – It contains subdirectories where removal media devices inserted.

  • /mnt – It contains temporary mount directories for mounting the file system.

  • /proc – It is a virtual and pseudo-file system to contains info about the running processes with a specific process ID or PID.

  • /run – It stores volatile runtime data.

  • /sbin – binary executable programs for an administrator.

  • /srv – It contains server-specific and server-related files.

  • /sys – It is a virtual filesystem for modern Linux distributions to store and allows modification of the devices connected to the system.

  • /etc/fstab – Information of the Disk Drive and their mount point.

  • /etc/group – It is a text file to define Information of Security Group.

  • /etc/grub.conf – It is the grub bootloader configuration file.

  • /etc/init.d – Service startup Script.

  • /etc/lilo.conf – It contains lilo bootloader configuration file.

  • /etc/hosts – Information of IP and corresponding hostnames.

  • /etc/hosts.allow – It contains a list of hosts allowed accessing services on the local machine.

  • /etc/host.deny – List of hosts denied to access services on the local machine.

  • /etc/inittab – INIT process and their interaction at the various run level.

  • /etc/issue – Allows editing the pre-login message.

  • /etc/modules.conf – It contains the configuration files for the system modules.

  • /etc/motd – It contains the message of the day.

  • /etc/mtab – Currently mounted blocks information.

  • /etc/passwd – It contains username, password of the system, users in a shadow file.

  • /etc/printcap – It contains printer Information.

  • /etc/profile – Bash shell defaults.

  • /etc/profile.d – It contains other scripts like application scripts, executed after login.

  • /etc/rc.d – It avoids script duplication.

  • /etc/rc.d/init.d – Run Level Initialisation Script.

  • /etc/resolv.conf – DNS being used by System.

  • /etc/security – It contains the name of terminals where root login is possible.

  • /etc/skel – Script that initiates new user home directory.

  • /etc/termcap – An ASCII file that defines the behavior of different types of the terminal.

  • /etc/X11 – Directory tree contains all the conf files for the X-window System.

  • /usr/share – It contains architecture independent shareable text files.

  • /usr/lib – It contains object files and libraries.

  • /usr/sbin – It contains commands for Super User, for System Administration.

  • /proc/ioports – Contains all the Input and Output addresses used by devices on the server.

  • /proc/meminfo – It reports the memory usage information.

  • /proc/modules – Currently using kernel module.

  • /proc/mount – Mounted File-system Information.

  • /proc/stat – It displays the detailed statistics of the current system.

  • /proc/swaps – It contains swap file information.

  • Linux Directory Structure
    POSIX shell
    SeMA Deployment Logical Architecture
    SeMA Deployment Architecture

    Displays PCI devices in a tree-like diagram

    lsusb -tv

    Displays USB devices in a tree-like diagram

    dmidecode

    Displays hardware information from the BIOS

    hdparm -i /dev/xda

    Displays information about disk data

    hdparm -tT /dev/xda <:code>

    Conducts a read speed test on device xda

    badblocks -s /dev/xda

    Tests for unreadable blocks on disk

    Used for changing / modifying user information

    Removes a directory forcefully and recursively

    cp file1 file2

    Copies the contents of file1 to file2

    cp -r dir1 dir2

    Recursively Copies dir1 to dir2. dir2 is created if it does not exist

    mv file1 file2

    Renames file1 to file2

    ln -s /path/to/file_name link_name

    Creates a symbolic link to file_name

    touch file_name

    Creates a new file

    cat > file_name

    Places standard input into a file

    more file_name

    Outputs the contents of a file

    head file_name

    Displays the first 10 lines of a file

    tail file_name

    Displays the last 10 lines of a file

    gpg -c file_name

    Encrypts a file

    gpg file_name.gpg

    Decrypts a file

    wc

    Prints the number of bytes, words and lines in a file

    xargs

    Executes commands from standard input

    Sends a signal to a process with its name

    bg

    Resumes suspended jobs in the background

    fg

    Brings suspended jobs to the foreground

    fg n

    job n to the foreground

    lsof

    Lists files that are open by processes

    renice 19 PID

    makes a process run with very low priority

    pgrep firefox

    find Firefox process ID

    pstree

    visualizing processes in tree model

    Change owner and group owner of the directory

    Performs reverse lookup on a domain

    host google.com

    Performs an IP lookup for the domain name

    hostname -i

    Displays local IP address

    wget file_name

    Downloads a file from an online source

    netstat -pnltu

    Displays all active listening ports

    uname

    Displays Linux system information

    uname -r

    Displays kernel release information

    uptime

    Displays how long the system has been running including load average

    hostname

    Shows the system hostname

    hostname -i

    Displays the IP address of the system

    last reboot

    Shows system reboot history

    date

    Displays current system date and time

    timedatectl

    Query and change the System clock

    cal

    Displays the current calendar month and day

    w

    Displays currently logged in users in the system

    whoami

    Displays who you are logged in as

    finger username

    Displays information about the user

    dmesg

    Displays bootup messages

    cat /proc/cpuinfo

    Displays more information about CPU e.g model, model name, cores, vendor id

    cat /proc/meminfo

    Displays more information about hardware memory e.g. Total and Free memory

    lshw

    Displays information about system's hardware configuration

    lsblk

    Displays block devices related information

    free -m

    Displays free and used memory in the system (-m flag indicates memory in MB)

    id

    Displays the details of the active user e.g. uid, gid, and groups

    last

    Shows the last logins in the system

    who

    Shows who is logged in to the system

    groupadd "admin"

    Adds the group 'admin'

    adduser "Sam"

    Adds user Sam

    userdel "Sam"

    Deletes user Sam

    ls -al

    Lists files - both regular & hidden files and their permissions as well.

    pwd

    Displays the current directory file path

    mkdir 'directory_name'

    Creates a new directory

    rm file_name

    Removes a file

    rm -f filename

    Forcefully removes a file

    rm -r directory_name

    Removes a directory recursively

    ps

    Display currently active processes

    ps aux | grep 'telnet'

    Searches for the id of the process 'telnet'

    pmap

    Displays memory map of processes

    top

    Displays all running processes

    kill pid

    Terminates process with a given pid

    killall proc

    Kills / Terminates all processes named proc

    chmod octal filename

    Change file permissions of the file to octal

    chmod 777 /data/test.c

    Set rwx permissions to owner, group and everyone (everyone else who has access to the server)

    chmod 755 /data/test.c

    Set rwx to the owner and r_x to group and everyone

    chmod 766 /data/test.c

    Sets rwx for owner, rw for group and everyone

    chown owner user-file

    Change ownership of the file

    chown owner-user:owner-group file_name

    Change owner and group owner of the file

    ip addr show

    Displays IP addresses and all the network interfaces

    ip address add 192.168.0.1/24 dev eth0

    Assigns IP address 192.168.0.1 to interface eth0

    ifconfig

    Displays IP addresses of all network interfaces

    ping host

    ping command sends an ICMP echo request to establish a connection to server / PC

    whois domain

    Retrieves more information about a domain name

    dig domain

    Retrieves DNS information about the domain

    tar -cf home.tar home<:code>

    Creates archive file called 'home.tar' from file 'home'

    tar -xf files.tar

    Extract archive file 'files.tar'

    tar -zcvf home.tar.gz source-folder

    Creates gzipped tar archive file from the source folder

    gzip file

    Compression a file with .gz extension

    rpm -i pkg_name.rpm

    Install an rpm package

    rpm -e pkg_name

    Removes an rpm package

    dnf install pkg_name

    Install package using dnf utility

    ./configure

    Checks your system for the required software needed to build the program. It will build the Makefile containing the instructions required to effectively build the project

    make

    It reads the Makefile to compile the program with the required operations. The process may take some time, depending on your system and the size of the program

    make install

    The command installs the binaries in the default/modified paths after the compilation

    grep 'pattern' files

    Search for a given pattern in files

    grep -r pattern dir

    Search recursively for a pattern in a given directory

    locate file

    Find all instances of the file

    find /home/ -name "index"

    Find file names that begin with 'index' in /home folder

    find /home -size +10000k

    Find files greater than 10000k in the home folder

    ssh user@host

    Securely connect to host as user

    ssh -p port_number user@host

    Securely connect to host using a specified port

    ssh host

    Securely connect to the system via SSH default port 22

    telnet host

    Connect to host via telnet default port 23

    scp file1.txt server2/tmp

    Securely copy file1.txt to server2 in /tmp directory

    rsync -a /home/apps /backup/

    Synchronize contents in /home/apps directory with /backup directory

    df -h

    Displays free space on mounted systems

    df -i

    Displays free inodes on filesystems

    fdisk -l

    Shows disk partitions, sizes, and types

    du -sh

    Displays disk usage in the current directory in a human-readable format

    findmnt

    Displays target mount point for all filesystems

    mount device-path mount-point

    Mount a device

    cd ..

    Move up one level in the directory tree structure

    cd

    Change directory to $HOME directory

    cd /test

    Change directory to /test directory

    lspci -tv

    usermod

    rm -rf directory_name

    pkill process-name

    chown owner-user:owner-group directory

    dig -x host

    Dockerfile

    Dockerfiles provide business applications with more flexibility and mobility. Dockerfiles are used by IT companies to bundle programs and their dependencies in a virtual container that may operate on bare metal, in public or private clouds, or on-premises. Numerous apps, worker tasks, and other activities can operate independently on a single physical computer or across multiple virtual machines using containers. Kubernetes is an open-source solution for automating the management and orchestration of Dockerfile-based containerized applications.

    10 % [ Minimum ]

    500000

    50000

    20 % [ Average ]

    500000

    100000

    30 % [ Recommended ]

    500000

    150000

    40 % [ Highly Scaled ]

    500000

    250000

    Number of portal Users [500000]
    Number of concurrent users =  40 * 500000 / 100 = 200000 
    × Number of Woker = 200000 / 20 = 100 Woker 
    x Number of Workers / VM = 33
    x Number of Core / VM = 16 core 
    x RAM cacpity estimation [ 1 core * 4 ] = 16 * 4 = 64 Gb / VM
    
    Minimum 4 VM with 16 core / 64 Gb RAM
    Recommended 5 VM x with 16 core / 64 Gb RAM
     
    Number of Users [ 5000 ]
    × Number of events per host per day [ 15 ]
    × 5Kb per event
    
    Number of Users × Number of events per host per day
    × 5Kb per event
    
    For example, an organization of 5,000 Users, with each user generating 
    an average of 15 events per day, 
    requiring a 30 day retention would require a database capacity of:
    
    ## DB stoage sizing / Month
          5,000 × 15 × 5 × 30 = 11,250,000Kb, or 11Gb
    
    ## DB stoage sizing / Year
          11 GB per Month x 12 = 132 Gb / Year
    
    DB HW sizing for 5000 client connections / sec
    
    # DB Version: 14
    # OS Type: linux
    # DB Type: web
    # Total Memory (RAM): 96 GB
    # CPUs num: 24
    # Connections num: 5000
    # Data Storage: san
    
    max_connections = 5000
    shared_buffers = 24GB
    effective_cache_size = 72GB
    maintenance_work_mem = 2GB
    checkpoint_completion_target = 0.9
    wal_buffers = 16MB
    default_statistics_target = 100
    random_page_cost = 1.1
    effective_io_concurrency = 300
    work_mem = 1258kB
    min_wal_size = 1GB
    max_wal_size = 4GB
    max_worker_processes = 24
    max_parallel_workers_per_gather = 4
    max_parallel_workers = 24
    max_parallel_maintenance_workers = 4
    x Number of users  [ 5000 ]
    × Number of survey per user  per day  [ 2 ]
    × 25 Mb per survey attachment  [ 25 mb ]
    Number of Users × Number of survey per user  per day
    × 25 Mb per survey attachment
    
    ## File storage sizing / Month
    
          5,000 × 2 x 25 Mb × 30 = 750 Gb
    
    ## File storage sizing / Year
     
          750 GB per Month x 12 = 9 TB  / Year
    
    
    Popovers
  • Icons

  • Typography

  • Animated searches

  • Forms

  • Tabs

  • Notifications

  • Tables

  • Maps

  • Charts

  • Editors

  • Any bugs that need to be improved must be addressed at the release branch.
  • The release branch must have to be merged back into developing as well as the master branch.

  • After merging, the release branch with the develop branch must be tagged with a version number.

  • Visit Herearrow-up-right
    Git tagarrow-up-right
    distributed
    . Distributed means that instead of switching the project to another machine, we can create a "clone" of the entire repository. Also, instead of just having one central repository that you send changes to, every user has their own repository that contains the entire commit history of the project. We do not need to connect to the remote repository; the change is just stored on our local repository. If necessary, we can push these changes to a remote repository.
    ignores
    runtime overheads associated with other high-level languages. Git was developed to work on the Linux kernel; therefore, it is
    capable
    enough to
    handle large
    repositories
    effectively. From the beginning,
    speed
    and
    performance
    have been Git's primary goals.
  • Supports non-linear development Git supports seamless branching and merging, which helps in visualizing and navigating a non-linear development. A branch in Git represents a single commit. We can construct the full branch structure with the help of its parental commit.

  • Branching and Merging Branching and merging are the great features of Git, which makes it different from the other SCM tools. Git allows the creation of multiple branches without affecting each other. We can perform tasks like creation, deletion, and merging on branches, and these tasks take a few seconds only. Below are some features that can be achieved by branching:

    • We can create a separate branch for a new module of the project, commit and delete it whenever we want.

    • We can have a production branch, which always has what goes into production and can be merged for testing in the test branch.

    • We can create a demo branch for the experiment and check if it is working. We can also remove it if needed.

    • The core benefit of branching is if we want to push something to a remote repository, we do not have to push all of our branches. We can select a few of our branches, or all of them together.

  • Data Assurance The Git data model ensures the cryptographic integrity of every unit of our project. It provides a unique commit ID to every commit through a SHA algorithm. We can retrieve and update the commit by commit ID. Most of the centralized version control systems do not provide such integrity by default.

  • Staging Area The Staging area is also a unique functionality of Git. It can be considered as a preview of our next commit, moreover, an intermediate area where commits can be formatted and reviewed before completion. When you make a commit, Git takes changes that are in the staging area and make them as a new commit. We are allowed to add and remove changes from the staging area. The staging area can be considered as a place where Git stores the changes. Although, Git doesn't have a dedicated staging directory where it can store some objects representing file changes (blobs). Instead of this, it uses a file called index.

  • Undo Mistakes
    One additional benefit of Git is we can
    Undo
    mistakes. Sometimes the undo can be a savior option for us. Git provides the undo option for almost everything.
  • Track the Changes Git facilitates with some exciting features such as Diff, Log, and Status, which allows us to track changes so we can check the status, compare our files or branches.

  • Everything is Local Almost All operations of Git can be performed locally; this is a significant reason for the use of Git. We will not have to ensure internet connectivity.

  • Collaborate to Public Projects There are many public projects available on the GitHub. We can collaborate on those projects and show our creativity to the world. Many developers are collaborating on public projects. The collaboration allows us to stand with experienced developers and learn a lot from them; thus, it takes our programming skills to the next level.

  • Impress Recruiters We can impress recruiters by mentioning the Git and GitHub on our resume. Send your GitHub profile link to the HR of the organization you want to join. Show your skills and influence them through your work. It increases the chances of getting hired.

  • Benefits of Git

    The Version Control System is very helpful and beneficial in software development; developing software without using version control is unsafe. It provides backups for uncertainty. Version control systems offer a speedy interface to developers. It also allows software teams to preserve efficiency and agility according to the team scales to include more developers.

    Some key benefits of having a version control system are as follows.

    • Complete change history of the file

    hashtag
    Types of Version Control System

    • Localized version Control System

    • Centralized version control systems

    • Distributed version control systems

    Localized Version Control Systems

    The localized version control method is a common approach because of its simplicity. But this approach leads to a higher chance of error. In this approach, you may forget which directory you're in and accidentally write to the wrong file or copy over files you don't want to.

    To deal with this issue, programmers developed local VCSs that had a simple database. Such databases kept all the changes to files under revision control. A local version control system keeps local copies of the files.

    The major drawback of Local VCS is that it has a single point of failure.

    Centralized Version Control System

    The developers needed to collaborate with other developers on other systems. The localized version control system failed in this case. To deal with this problem, Centralized Version Control Systems were developed.

    These systems have a single server that contains the versioned files, and some clients to check out files from a central place.

    Centralized version control systems have many benefits, especially over local VCSs.

    • Everyone on the system has information about the work what others are doing on the project.

    • Administrators have control over other developers.

    • It is easier to deal with a centralized version control system than a localized version control system.

    • A local version control system facilitates with a server software component which stores and manages the different versions of the files.

    It also has the same drawback as in local version control system that it also has a single point of failure.

    Distributed Version Control System

    Centralized Version Control System uses a central server to store all the database and team collaboration. But due to single point failure, which means the failure of the central server, developers do not prefer it. Next, the Distributed Version Control System is developed.

    In a Distributed Version Control System (such as Git, Mercurial, Bazaar or Darcs), the user has a local copy of a repository. So, the clients don't just check out the latest snapshot of the files even they can fully mirror the repository. The local repository contains all the files and metadata present in the main repository.

    DVCS allows automatic management branching and merging. It speeds up of most operations except pushing and pulling. DVCS enhances the ability to work offline and does not rely on a single location for backups. If any server stops and other systems were collaborating via it, then any of the client repositories could be restored by that server. Every checkout is a full backup of all the data.

    These systems do not necessarily depend on a central server to store all the versions of a project file.

    hashtag
    Difference between Centralized Version Control System and Distributed Version Control System

    Centralized Version Control Systems are systems that use client/server architecture. In a centralized Version Control System, one or more client systems are directly connected to a central server. Contrarily the Distributed Version Control Systems are systems that use peer-to-peer architecture.

    There are many benefits and drawbacks of using both the version control systems. Let's have a look at some significant differences between Centralized and Distributed version control system.

    Centralized Version Control System

    Distributed Version Control System

    In CVCS, The repository is placed at one place and delivers information to many clients.

    In DVCS, Every user has a local copy of the repository in place of the central repository on the server-side.

    It is based on the client-server approach.

    It is based on the client-server approach.

    It is the most straightforward system based on the concept of the central repository.

    It is flexible and has emerged with the concept that everyone has their repository.

    In CVCS, the server provides the latest code to all the clients across the globe.

    In DVCS, every user can check out the snapshot of the code, and they can fully mirror the central repository.

    CVCS is easy to administrate and has additional control over users and access by its server from one place.

    DVCS is fast comparing to CVCS as you don't have to interact with the central server for every command.

    ​
    Git Commands

    ​

    This command is used to make a copy of a repository from an existing URL. If I want a local copy of my repository from GitHub, this command allows creating a local copy of that repository on your local directory from the repository URL.

    ​

    Git Commands

    ​

    This command is used to add one or more files to staging (Index) area.

    To add more than one file

    ​

    Git Commands

    ​

    Commit command is used in two scenarios. They are as follows.

    This command changes the head. It records or snapshots the file permanently in the version history with a message.

    1. 1.

      $ git commit -m " Commit Message"

    This command commits any files added in the repository with git add and also commits any files you've changed since then.

    ​

    Git Commands

    ​

    The status command is used to display the state of the working directory and the staging area. It allows you to see which changes have been staged, which haven't, and which files aren?t being tracked by Git. It does not show you any information about the committed project history. For this, you need to use the git log. It also lists the files that you've changed and those you still need to add or commit.

    ​

    Git Commands

    ​

    It is used to upload local repository content to a remote repository. Pushing is an act of transfer commits from your local repository to a remote repo. It's the complement to git fetch, but whereas fetching imports commits to local branches on comparatively pushing exports commits to remote branches. Remote branches are configured by using the git remote command. Pushing is capable of overwriting changes, and caution should be taken when pushing.

    Git push command can be used as follows.

    This command sends the changes made on the master branch, to your remote repository.

    1. 1.

      $ git push [variable name] master

    This command pushes all the branches to the server repository.

    ​

    Git Commands

    ​

    Pull command is used to receive data from GitHub. It fetches and merges changes on the remote server to your working directory.

    ​

    Git Commands

    ​

    This command lists all the branches available in the repository.

    ​

    Git Commands

    ​

    This command is used to merge the specified branch?s history into the current branch.

    ​

    Git Commands

    ​

    This command is used to check the commit history.

    ​

    Git Commands

    ​

    By default, if no argument passed, Git log shows the most recent commits first. We can limit the number of log entries displayed by passing a number as an option, such as -3 to show only the last three entries.

    Git Remote command is used to connect your local repository to the remote server. This command allows you to create, view, and delete connections to other repositories. These connections are more like bookmarks rather than direct links into other repositories. This command doesn't provide real-time access to repositories.

    ​

    Git Commands

    ​

    Listeners

    The Listeners directory holds all your project's handler class for which are used for receiving and handling events.

    Mail

    The Main directory holds all the emails send by through your Laravel project, and this directory needs to be created using the command:

    Notifications

    The Notifications directory contains all your transactional notifications sent through your Laravel project, and this directory needs to be created using the command:

    Policies

    The policies directory holds different policies for your laravel project.

    Providers

    The Providers directory is used for containing different service providers.

    Rules

    The Rules directory hold all the different objects related to custom validation rules, and this directory needs to be created using the command:

    Ceph monitor podsarrow-up-right
    https://matser-ip:31000arrow-up-right
    Kubernetes Architecture
    Weave Network installation
    Rook Architecture on Kubernetes
    Rook Components on Kubernetes
    Leiningen (http://leiningen.org/)arrow-up-right

    Containerization

    The launch of Docker in 2013 jump started a revolution in application development – by democratizing software containers. Docker developed a Linux container technology – one that is portable, flexible and easy to deploy. Docker open sourced libcontainer and partnered with a worldwide community of contributors to further its development. In June 2015, Docker donated the container image specification and runtime code now known as runc, to the Open Container Initiative (OCI) to help establish standardization as the container ecosystem grows and matures.

    Following this evolution, Docker continues to give back with the containerd project, which Docker donated to the Cloud Native Computing Foundation (CNCF) in 2017. containerd is an industry-standard container runtime that leverages runc and was created with an emphasis on simplicity, robustness and portability. containerd is the core container runtime of the Docker Engine.

    hashtag
    Comparing Containers and Virtual Machines

    Containers and virtual machines have similar resource isolation and allocation benefits, but function differently because containers virtualize the operating system instead of hardware. Containers are more portable and efficient.

    Containers are an abstraction at the app layer that packages code and dependencies together. Multiple containers can run on the same machine and share the OS kernel with other containers, each running as isolated processes in user space. Containers take up less space than VMs (container images are typically tens of MBs in size), can handle more applications and require fewer VMs and Operating systems.

    Virtual machines (VMs) are an abstraction of physical hardware turning one server into many servers. The hypervisor allows multiple VMs to run on a single machine. Each VM includes a full copy of an operating system, the application, necessary binaries and libraries – taking up tens of GBs. VMs can also be slow to boot.

    hashtag
    Docker Engine Sparked the Containerization Movement

    Docker Engine is the industry’s de facto container runtime that runs on various Linux (

    ,

    ,

    ,

    ,

    , and

    ) and

    operating systems. Docker creates simple tooling and a universal packaging approach that bundles up all application dependencies inside a container which is then run on Docker Engine. Docker Engine enables containerized applications to run anywhere consistently on any infrastructure, solving “dependency hell” for developers and operations teams, and eliminating the “it works on my laptop!” problem.

    hashtag
    Package Software into Standardized Units for Development, Shipment and Deployment

    A container is a standard unit of software that packages up code and all its dependencies so the application runs quickly and reliably from one computing environment to another. A Docker container image is a lightweight, standalone, executable package of software that includes everything needed to run an application: code, runtime, system tools, system libraries and settings.

    Container images become containers at runtime and in the case of Docker containers – images become containers when they run on

    . Available for both Linux and Windows-based applications, containerized software will always run the same, regardless of the infrastructure. Containers isolate software from its environment and ensure that it works uniformly despite differences for instance between development and staging.

    Docker containers that run on Docker Engine:

    • Standard: Docker created the industry standard for containers, so they could be portable anywhere

    • Lightweight: Containers share the machine’s OS system kernel and therefore do not require an OS per application, driving higher server efficiencies and reducing server and licensing costs

    • Secure: Applications are safer in containers and Docker provides the strongest default isolation capabilities in the industry

    Git Remote

    In Git, the term remote is concerned with the remote repository. It is a shared repository that all team members use to exchange their changes. A remote repository is stored on a code hosting service like an internal server, GitHub, Subversion, and more. In the case of a local repository, a remote typically does not provide a file tree of the project's current state; as an alternative, it only consists of the .git versioning data.

    The developers can perform many operations with the remote server. These operations can be a clone, fetch, push, pull, and more. Consider the below image:

    To check the configuration of the remote server, run the git remote command. The git remote command allows accessing the connection between remote and local. If you want to see the original existence of your cloned repository, use the git remote command. It can be used as:

    ​

    Git Remote

    ​

    The given command is providing the remote name as the origin. Origin is the default name for the remote server, which is given by Git.

    Git remote supports a specific option -v to show the URLs that Git has stored as a short name. These short names are used during the reading and write operation. Here, -v stands for verbose. We can use --verbose in place of -v. It is used as:

    The above output is providing available remote connections. If a repository contains more than one remote connection, this command will list them all.

    When we fetch a repository implicitly, git adds a remote for the repository. Also, we can explicitly add a remote for a repository. We can add a remote as a shot nickname or short name. To add remote as a short name, follow the below command:

    1. 1.

      $ git remote add <short name><remote URL>

    In the above output, I have added a remote repository with an existing repository as a short name "hd". Now, you can use "hd" on the command line in place of the whole URL. For example, you want to pull the repository, consider below output:

    I have pulled a repository using its short name instead of its remote URL. Now, the repository master branch can be accessed through a short name.

    Fetching and Pulling Remote Branch

    You can fetch and pull data from the remote repository. The fetch and pull command goes out to that remote server, and fetch all the data from that remote project that you don't have yet. These commands let us fetch the references to all the branches from that remote.

    To fetch the data from your remote projects, run the below command:

    To clone the remote repository from your remote projects, run the below command:

    When we clone a repository, the remote repository is added by a default name "origin." So, mostly, the command is used as git fetch origin.

    The git fetch origin fetches the updates that have been made to the remote server since you cloned it. The git fetch command only downloads the data to the local repository; it doesn't merge or modify the data until you don't operate. You have to merge it manually into your repository when you want.

    To pull the repository, run the below command:

    The git pull command automatically fetches and then merges the remote data into your current branch. Pulling is an easier and comfortable workflow than fetching. Because the git clone command sets up your local master branch to track the remote master branch on the server you cloned.

    If you want to share your project, you have to push it upstream. The git push command is used to share a project or send updates to the remote server. It is used as:

    1. 1.

      $ git push <remote><branch>

    To update the main branch of the project, use the below command:

    It is a special command-line utility that specifies the remote branch and directory. When you have multiple branches on a remote server, then this command assists you to specify your main branch and repository.

    Generally, the term origin stands for the remote repository, and master is considered as the main branch. So, the entire statement "git push origin master" pushed the local content on the master branch of the remote location.

    You can remove a remote connection from a repository. To remove a connection, perform the git remote command with remove or rm option. It can be done as:

    1. 1.

      $ git remote rm <destination>

    2. 1.

      $ git remote remove <destination>

    Consider the below example:

    Suppose you are connected with a default remote server "origin." To check the remote verbosely, perform the below command:

    The above output will list the available remote server. Now, perform the remove operation as mentioned above. Consider the below output:

    In the above output, I have removed remote server "origin" from my repository.

    Git allows renaming the remote server name so that you can use a short name in place of the remote server name. Below command is used to rename the remote server:

    1. 1.

      $ git remote rename <old name><new name>

    In the above output, I have renamed my default server name origin to hd. Now, I can operate using this name in place of origin. Consider the below output:

    In the above output, I have pulled the remote repository using the server name hd. But, when I am using the old server name, it is throwing an error with the message "'origin' does not appear to be a git repository." It means Git is not identifying the old name, so all the operations will be performed by a new name.

    To see additional information about a particular remote, use the git remote command along with show sub-command. It is used as:

    1. 1.

      $ git remote show <remote>

    It will result in information about the remote server. It contains a list of branches related to the remote and also the endpoints attached for fetching and pushing.

    The above output is listing the URLs for the remote repository as well as the tracking branch information. This information will be helpful in various cases.

    hashtag
    Git Change Remote (Changing a Remote's URL)

    We can change the URL of a remote repository. The git remote set command is used to change the URL of the repository. It changes an existing remote repository URL.

    We can change the remote URL simply by using the git remote set command. Suppose we want to make a unique name for our project to specify it. Git allows us to do so. It is a simple process. To change the remote URL, use the below command:

    1. 1.

      $ git remote set-url <remote name><newURL>

    The remote set-url command takes two types of arguments. The first one is <remote name >, it is your current server name for the repository. The second argument is <newURL>, it is your new URL name for the repository. The <new URL> should be in below format: https://github.com/URLChanged

    Consider the below image:

    In the above output, I have changed my existing repository URL as https://github.com/URLChanged from https://github.com/ImDwivedi1/GitExample2. It can be understood by my URL name that I have changed this. To check the latest URL, perform the below command:

    Docker Compose

    hashtag
    Key features and use cases

    Using Compose is essentially a three-step process:

    1. 1.

      Define your app’s environment with a Dockerfile so it can be reproduced anywhere.

    2. 2.

      Define the services that make up your app in docker-compose.yml so they can be run together in an isolated environment.

    3. 3.

      Run docker compose up and the Docker compose command starts and runs your entire app. You can alternatively run docker-compose up using Compose standalone(docker-compose binary).

    A docker-compose.yml looks like this:

    version: "3.9" # optional since v1.27.0

    hashtag
    Key features of Docker Compose

    Have multiple isolated environments on a single host

    Compose uses a project name to isolate environments from each other. You can make use of this project name in several different contexts:

    • on a dev host, to create multiple copies of a single environment, such as when you want to run a stable copy for each feature branch of a project

    • on a CI server, to keep builds from interfering with each other, you can set the project name to a unique build number

    • on a shared host or dev host, to prevent different projects, which may use the same service names, from interfering with each other

    The default project directory is the base directory of the Compose file. A custom value for it can be defined with the --project-directory command line option.

    Preserves volume data when containers are created

    Compose preserves all volumes used by your services. When docker compose up runs, if it finds any containers from previous runs, it copies the volumes from the old container to the new container. This process ensures that any data you’ve created in volumes isn’t lost.

    If you use docker compose on a Windows machine, see

    and adjust the necessary environment variables for your specific needs.

    Only recreate containers that have changed

    Compose caches the configuration used to create a container. When you restart a service that has not changed, Compose re-uses the existing containers. Re-using containers means that you can make changes to your environment very quickly.

    Supports variables and moving a composition between environments

    Compose supports variables in the Compose file. You can use these variables to customize your composition for different environments, or different users. See

    for more details.

    You can extend a Compose file using the extends field or by creating multiple Compose files. See

    for more details.

    hashtag
    Common use cases of Docker Compose

    Compose can be used in many different ways. Some common use cases are outlined below.

    When you’re developing software, the ability to run an application in an isolated environment and interact with it is crucial. The Compose command line tool can be used to create the environment and interact with it.

    The

    provides a way to document and configure all of the application’s service dependencies (databases, queues, caches, web service APIs, etc). Using the Compose command line tool you can create and start one or more containers for each dependency with a single command (docker compose up).

    Together, these features provide a convenient way for developers to get started on a project. Compose can reduce a multi-page “developer getting started guide” to a single machine readable Compose file and a few commands.

    Automated testing environments

    An important part of any Continuous Deployment or Continuous Integration process is the automated test suite. Automated end-to-end testing requires an environment in which to run tests. Compose provides a convenient way to create and destroy isolated testing environments for your test suite. By defining the full environment in a

    , you can create and destroy these environments in just a few commands:

    Compose has traditionally been focused on development and testing workflows, but with each release we’re making progress on more production-oriented features.

    Git Tags

    Tags make a point as a specific point in Git history. Tags are used to mark a commit stage as relevant. We can tag a commit for future reference. Primarily, it is used to mark a project's initial point like v1.1.

    Tags are much like branches, and they do not change once initiated. We can have any number of tags on a branch or different branches. The below figure demonstrates the tags on various branches.

    In the above image, there are many versions of a branch. All these versions are tags in the repository.

    There are two types of tags.

    Both of these tags are similar, but they are different in case of the amount of Metadata stores.

    Merge vs Rebase

    The git rebase command has a reputation for being magical Git hocus pocus that beginners should stay away from, but it can actually make life much easier for a development team when used with care. In this article, we’ll compare git rebase with the related git merge command and identify all of the potential opportunities to incorporate rebasing into the typical Git workflow.

    The first thing to understand about git rebase is that it solves the same problem as git merge. Both of these commands are designed to integrate changes from one branch into another branch—they just do it in very different ways.

    Consider what happens when you start working on a new feature in a dedicated branch, then another team member updates the main

    Docker Architecture

    Before learning the Docker architecture, first, you should know about the Docker Daemon.

    Docker daemon runs on the host operating system. It is responsible for running containers to manage docker services. Docker daemon communicates with other daemons. It offers various Docker objects such as images, containers, networking, and storage. s

    Docker follows Client-Server architecture, which includes the three main components that are Docker Client, Docker Host, and Docker Registry.

    Docker client uses commands and REST APIs to communicate with the Docker Daemon (Server). When a client runs any docker command on the docker client terminal, the client terminal sends these docker commands to the Docker daemon. Docker daemon receives these commands from the docker client in the form of command and REST API's request.

    Git Merge and Merge Conflict

    In Git, the merging is a procedure to connect the forked history. It joins two or more development history together. The git merge command facilitates you to take the data created by git branch and integrate them into a single branch. Git merge will associate a series of commits into one unified history. Generally, git merge is used to combine two branches.

    It is used to maintain distinct lines of development; at some stage, you want to merge the changes in one branch. It is essential to understand how merging works in Git.

    In the above figure, there are two branches master and feature. We can see that we made some commits in both functionality and master branch, and merge them. It works as a pointer. It will find a common base commit between branches. Once Git finds a shared base commit, it will create a new "merge commit." It combines the changes of each queued merge commit sequence.

    The git merge command is used to merge the branches.

    Git Terminology

    Git is a tool that covered vast terminology and jargon, which can often be difficult for new users, or those who know Git basics but want to become Git masters. So, we need a little explanation of the terminology behind the tools. Let's have a look at the commonly used terms.

    Some commonly used terms are:

    A branch is a version of the repository that diverges from the main working project. It is an essential feature available in most modern version control systems. A Git project can have more than one branch. We can perform many operations on Git branch-like rename, list, delete, etc.

    In Git, the term checkout is used for the act of switching between different versions of a target entity. The git checkout command is used to switch between branches in a repository.

    Cherry-picking in Git is meant to apply some commit from one branch into another branch. In case you made a mistake and committed a change into the wrong branch, but do not want to merge the whole branch. You can revert the commit and cherry-pick it on another branch.

    Git Stash

    Sometimes you want to switch the branches, but you are working on an incomplete part of your current project. You don't want to make a commit of half-done work. Git stashing allows you to do so. The git stash command enables you to switch branches without committing the current branch.

    The below figure demonstrates the properties and role of stashing concerning repository and working directory.

    Generally, the stash's meaning is "store something safely in a hidden place." The sense in Git is also the same for stash; Git temporarily saves your data safely without committing.

    Stashing takes the messy state of your working directory, and temporarily save it for further use. Many options are available with git stash. Some useful options are given below:

    FLUSH PRIVILEGES;
    +-----------------------------------------------------------------------------------------------------------------+
    | Grants for demouser@localhost                                                                                   |
    +-----------------------------------------------------------------------------------------------------------------+
    | GRANT USAGE ON *.* TO 'demouser'@'localhost' IDENTIFIED BY PASSWORD '*0756A562377EDF6ED3AC45A00B356AAE6D3C6BB6' |
    | GRANT ALL PRIVILEGES ON `demodb`.* TO 'demouser'@'localhost'                                                    |
    +-----------------------------------------------------------------------------------------------------------------+
    2 rows in set (0.00 sec)
    wget https://raw.githubusercontent.com/omarabdalhamid/Kubernetes-install/master/kmaster.sh && sh kmaster.sh
    #!/bin/bash
    apt-get update -y
    
    apt-get install \
        apt-transport-https \
        ca-certificates \
        curl \
        software-properties-common -y
    
    apt install ntp -y
    
    apt install libltdl7 -y
    
    service ntp start
    systemctl enable ntp
    
    #curl -fsSL https://download.docker.com/linux/debian/gpg | sudo apt-key add - \
    #    && sudo add-apt-repository "deb [arch=amd64] https://download.docker.com/linux/ubuntu xenial stable" \
    #    && sudo apt-get update \
    #    && sudo apt-get install docker-ce=18.03.1~ce-0~ubuntu -yq
    sudo  wget https://download.docker.com/linux/ubuntu/dists/bionic/pool/stable/amd64/docker-ce-cli_18.09.0~3-0~ubuntu-bionic_amd64.deb
    sudo  dpkg -i  docker-ce-cli_18.09.0~3-0~ubuntu-bionic_amd64.deb
    sudo  add-apt-repository universe -y
    
    apt-get install docker-compose -y


    curl -L https://github.com/docker/machine/releases/download/v0.13.0/docker-machine-`uname -s`-`uname -m` >/tmp/docker-machine && \
    chmod +x /tmp/docker-machine && \
    sudo cp /tmp/docker-machine /usr/local/bin/docker-machine
    
    service docker start
    
    systemctl enable docker 
    
    cat > /etc/docker/daemon.json <<EOF
    {
      "exec-opts": ["native.cgroupdriver=systemd"],
      "log-driver": "json-file",
      "log-opts": {
        "max-size": "100m"
      },
      "storage-driver": "overlay2"
    }
    EOF
    
    mkdir -p /etc/systemd/system/docker.service.d
    
    # Restart docker.
    systemctl daemon-reload
    systemctl restart docker
    
    
    apt-get update && apt-get install -y apt-transport-https curl
    curl -s https://packages.cloud.google.com/apt/doc/apt-key.gpg | apt-key add -
    cat <<EOF >/etc/apt/sources.list.d/kubernetes.list
    deb https://apt.kubernetes.io/ kubernetes-xenial main
    EOF
    apt-get update
    apt-get install -y kubelet kubeadm kubectl
    apt-mark hold kubelet kubeadm kubectl
    
    kubeadm init --token=102952.1a7dd4cc8d1f4cc5 --kubernetes-version $(kubeadm version -o short)
    
    sudo cp /etc/kubernetes/admin.conf $HOME/
    sudo chown $(id -u):$(id -g) $HOME/admin.conf
    export KUBECONFIG=$HOME/admin.conf
    
    
    kubectl taint nodes --all node-role.kubernetes.io/master-
    wget https://raw.githubusercontent.com/omarabdalhamid/Kubernetes-install/master/knode2.sh && sh knode2.sh 
    #!/bin/bash
    apt-get update -y
    
    
    apt-get install \
        apt-transport-https \
        ca-certificates \
        curl \
        software-properties-common -y
    
    apt install ntp -y
    
    service ntp start
    systemctl enable ntp
    
    # Install Docker CE
    ## Set up the repository:
    ### Install packages to allow apt to use a repository over HTTPS
    
    ### Add Docker’s official GPG key
    curl -fsSL https://download.docker.com/linux/ubuntu/gpg | apt-key add -
    
    ### Add Docker apt repository.
    add-apt-repository \
      "deb [arch=amd64] https://download.docker.com/linux/ubuntu \
      $(lsb_release -cs) \
      stable"
    
    ## Install Docker CE.
    apt-get update && apt-get install docker-ce=18.06.2~ce~3-0~ubuntu
    
    # Setup daemon.
    cat > /etc/docker/daemon.json <<EOF
    {
      "exec-opts": ["native.cgroupdriver=systemd"],
      "log-driver": "json-file",
      "log-opts": {
        "max-size": "100m"
      },
      "storage-driver": "overlay2"
    }
    EOF
    
    mkdir -p /etc/systemd/system/docker.service.d
    
    # Restart docker.
    systemctl daemon-reload
    systemctl restart docker
    
    sudo add-apt-repository universe -y
    
    apt-get install docker-compose -y
    
    
    curl -L https://github.com/docker/machine/releases/download/v0.13.0/docker-machine-`uname -s`-`uname -m` >/tmp/docker-machine && \
    chmod +x /tmp/docker-machine && \
    sudo cp /tmp/docker-machine /usr/local/bin/docker-machine
    
    service docker start
    
    systemctl enable docker 
    
    apt-get update && apt-get install -y apt-transport-https curl
    curl -s https://packages.cloud.google.com/apt/doc/apt-key.gpg | apt-key add -
    cat <<EOF >/etc/apt/sources.list.d/kubernetes.list
    deb https://apt.kubernetes.io/ kubernetes-xenial main
    EOF
    apt-get update
    apt-get install -y kubelet kubeadm kubectl
    apt-mark hold kubelet kubeadm kubectl
    
    wget https://raw.githubusercontent.com/omarabdalhamid/Kubernetes-install/master/kube-network.yaml && kubectl apply -f kube-network.yaml 
    apiVersion: v1
    kind: List
    items:
      - apiVersion: v1
        kind: ServiceAccount
        metadata:
          name: weave-net
          labels:
            name: weave-net
          namespace: kube-system
      - apiVersion: rbac.authorization.k8s.io/v1beta1
        kind: ClusterRole
        metadata:
          name: weave-net
          labels:
            name: weave-net
        rules:
          - apiGroups:
              - ''
            resources:
              - pods
              - namespaces
              - nodes
            verbs:
              - get
              - list
              - watch
          - apiGroups:
              - extensions
            resources:
              - networkpolicies
            verbs:
              - get
              - list
              - watch
          - apiGroups:
              - 'networking.k8s.io'
            resources:
              - networkpolicies
            verbs:
              - get
              - list
              - watch
          - apiGroups:
            - ''
            resources:
            - nodes/status
            verbs:
            - patch
            - update
      - apiVersion: rbac.authorization.k8s.io/v1beta1
        kind: ClusterRoleBinding
        metadata:
          name: weave-net
          labels:
            name: weave-net
        roleRef:
          kind: ClusterRole
          name: weave-net
          apiGroup: rbac.authorization.k8s.io
        subjects:
          - kind: ServiceAccount
            name: weave-net
            namespace: kube-system
      - apiVersion: rbac.authorization.k8s.io/v1beta1
        kind: Role
        metadata:
          name: weave-net
          namespace: kube-system
          labels:
            name: weave-net
        rules:
          - apiGroups:
              - ''
            resources:
              - configmaps
            resourceNames:
              - weave-net
            verbs:
              - get
              - update
          - apiGroups:
              - ''
            resources:
              - configmaps
            verbs:
              - create
      - apiVersion: rbac.authorization.k8s.io/v1beta1
        kind: RoleBinding
        metadata:
          name: weave-net
          namespace: kube-system
          labels:
            name: weave-net
        roleRef:
          kind: Role
          name: weave-net
          apiGroup: rbac.authorization.k8s.io
        subjects:
          - kind: ServiceAccount
            name: weave-net
            namespace: kube-system
      - apiVersion: apps/v1
        kind: DaemonSet
        metadata:
          name: weave-net
          labels:
            name: weave-net
          namespace: kube-system
        spec:
          # Wait 5 seconds to let pod connect before rolling next pod
          minReadySeconds: 5
          selector:
            matchLabels:
              name: weave-net      
          template:
            metadata:
              labels:
                name: weave-net
            spec:
              containers:
                - name: weave
                  command:
                    - /home/weave/launch.sh
                  env:
                    - name: HOSTNAME
                      valueFrom:
                        fieldRef:
                          apiVersion: v1
                          fieldPath: spec.nodeName
                  image: 'weaveworks/weave-kube:2.5.1'
                  imagePullPolicy: IfNotPresent
                  readinessProbe:
                    httpGet:
                      host: 127.0.0.1
                      path: /status
                      port: 6784
                  resources:
                    requests:
                      cpu: 10m
                  securityContext:
                    privileged: true
                  volumeMounts:
                    - name: weavedb
                      mountPath: /weavedb
                    - name: cni-bin
                      mountPath: /host/opt
                    - name: cni-bin2
                      mountPath: /host/home
                    - name: cni-conf
                      mountPath: /host/etc
                    - name: dbus
                      mountPath: /host/var/lib/dbus
                    - name: lib-modules
                      mountPath: /lib/modules
                    - name: xtables-lock
                      mountPath: /run/xtables.lock
                      readOnly: false
                - name: weave-npc
                  env:
                    - name: HOSTNAME
                      valueFrom:
                        fieldRef:
                          apiVersion: v1
                          fieldPath: spec.nodeName
                  image: 'weaveworks/weave-npc:2.5.1'
                  imagePullPolicy: IfNotPresent
    #npc-args
                  resources:
                    requests:
                      cpu: 10m
                  securityContext:
                    privileged: true
                  volumeMounts:
                    - name: xtables-lock
                      mountPath: /run/xtables.lock
                      readOnly: false
              hostNetwork: true
              hostPID: true
              restartPolicy: Always
              securityContext:
                seLinuxOptions: {}
              serviceAccountName: weave-net
              tolerations:
                - effect: NoSchedule
                  operator: Exists
              volumes:
                - name: weavedb
                  hostPath:
                    path: /var/lib/weave
                - name: cni-bin
                  hostPath:
                    path: /opt
                - name: cni-bin2
                  hostPath:
                    path: /home
                - name: cni-conf
                  hostPath:
                    path: /etc
                - name: dbus
                  hostPath:
                    path: /var/lib/dbus
                - name: lib-modules
                  hostPath:
                    path: /lib/modules
                - name: xtables-lock
                  hostPath:
                    path: /run/xtables.lock
                    type: FileOrCreate
          updateStrategy:
            type: RollingUpdate
    kubectl cluster-info 
    kubectl get node -o wide 
     kubectl get pods -n kube-system -o wide 
    git clone  https://github.com/rook/rook.git
    
    cd rook/cluster/examples/kubernetes/ceph/ 
     
    kubectl create -f operator.yaml 
    
    kubectl create -f cluster.yaml 
     
    kubectl -n rook-ceph-system get pod 
    
    kubectl apply -f toolbox.yaml 
    kubectl exec   -n rook-ceph rook-ceph-tools-856c5bc6b4-7bvf4 ceph status 
    wget https://raw.githubusercontent.com/omarabdalhamid/Kubernetes-install/master/dashboard.yaml && kubectl apply -f dashboard.yaml 
    # Copyright 2017 The Kubernetes Authors.
    #
    # Licensed under the Apache License, Version 2.0 (the "License");
    # you may not use this file except in compliance with the License.
    # You may obtain a copy of the License at
    #
    #     http://www.apache.org/licenses/LICENSE-2.0
    #
    # Unless required by applicable law or agreed to in writing, software
    # distributed under the License is distributed on an "AS IS" BASIS,
    # WITHOUT WARRANTIES OR CONDITIONS OF ANY KIND, either express or implied.
    # See the License for the specific language governing permissions and
    # limitations under the License.
    
    apiVersion: v1
    kind: Namespace
    metadata:
      name: kubernetes-dashboard
    
    ---
    
    apiVersion: v1
    kind: ServiceAccount
    metadata:
      labels:
        k8s-app: kubernetes-dashboard
      name: kubernetes-dashboard
      namespace: kubernetes-dashboard
    
    ---
    
    kind: Service
    apiVersion: v1
    metadata:
      labels:
        k8s-app: kubernetes-dashboard
      name: kubernetes-dashboard
      namespace: kubernetes-dashboard
    spec:
      type: LoadBalancer
      ports:
        - port: 443
          targetPort: 8443
          nodePort: 31000
      selector:
        k8s-app: kubernetes-dashboard
    
    ---
    
    apiVersion: v1
    kind: Secret
    metadata:
      labels:
        k8s-app: kubernetes-dashboard
      name: kubernetes-dashboard-certs
      namespace: kubernetes-dashboard
    type: Opaque
    
    ---
    
    apiVersion: v1
    kind: Secret
    metadata:
      labels:
        k8s-app: kubernetes-dashboard
      name: kubernetes-dashboard-csrf
      namespace: kubernetes-dashboard
    type: Opaque
    data:
      csrf: ""
    
    ---
    
    apiVersion: v1
    kind: Secret
    metadata:
      labels:
        k8s-app: kubernetes-dashboard
      name: kubernetes-dashboard-key-holder
      namespace: kubernetes-dashboard
    type: Opaque
    
    ---
    
    kind: ConfigMap
    apiVersion: v1
    metadata:
      labels:
        k8s-app: kubernetes-dashboard
      name: kubernetes-dashboard-settings
      namespace: kubernetes-dashboard
    
    ---
    
    kind: Role
    apiVersion: rbac.authorization.k8s.io/v1
    metadata:
      labels:
        k8s-app: kubernetes-dashboard
      name: kubernetes-dashboard
      namespace: kubernetes-dashboard
    rules:
      # Allow Dashboard to get, update and delete Dashboard exclusive secrets.
      - apiGroups: [""]
        resources: ["secrets"]
        resourceNames: ["kubernetes-dashboard-key-holder", "kubernetes-dashboard-certs", "kubernetes-dashboard-csrf"]
        verbs: ["get", "update", "delete"]
        # Allow Dashboard to get and update 'kubernetes-dashboard-settings' config map.
      - apiGroups: [""]
        resources: ["configmaps"]
        resourceNames: ["kubernetes-dashboard-settings"]
        verbs: ["get", "update"]
        # Allow Dashboard to get metrics.
      - apiGroups: [""]
        resources: ["services"]
        resourceNames: ["heapster", "dashboard-metrics-scraper"]
        verbs: ["proxy"]
      - apiGroups: [""]
        resources: ["services/proxy"]
        resourceNames: ["heapster", "http:heapster:", "https:heapster:", "dashboard-metrics-scraper", "http:dashboard-metrics-scraper"]
        verbs: ["get"]
    
    ---
    
    kind: ClusterRole
    apiVersion: rbac.authorization.k8s.io/v1
    metadata:
      labels:
        k8s-app: kubernetes-dashboard
      name: kubernetes-dashboard
    rules:
      # Allow Metrics Scraper to get metrics from the Metrics server
      - apiGroups: ["metrics.k8s.io"]
        resources: ["pods", "nodes"]
        verbs: ["get", "list", "watch"]
    
    ---
    
    apiVersion: rbac.authorization.k8s.io/v1
    kind: RoleBinding
    metadata:
      labels:
        k8s-app: kubernetes-dashboard
      name: kubernetes-dashboard
      namespace: kubernetes-dashboard
    roleRef:
      apiGroup: rbac.authorization.k8s.io
      kind: Role
      name: kubernetes-dashboard
    subjects:
      - kind: ServiceAccount
        name: kubernetes-dashboard
        namespace: kubernetes-dashboard
    
    ---
    
    apiVersion: rbac.authorization.k8s.io/v1
    kind: ClusterRoleBinding
    metadata:
      name: kubernetes-dashboard
    roleRef:
      apiGroup: rbac.authorization.k8s.io
      kind: ClusterRole
      name: kubernetes-dashboard
    subjects:
      - kind: ServiceAccount
        name: kubernetes-dashboard
        namespace: kubernetes-dashboard
    
    ---
    
    kind: Deployment
    apiVersion: apps/v1
    metadata:
      labels:
        k8s-app: kubernetes-dashboard
      name: kubernetes-dashboard
      namespace: kubernetes-dashboard
    spec:
      replicas: 1
      revisionHistoryLimit: 10
      selector:
        matchLabels:
          k8s-app: kubernetes-dashboard
      template:
        metadata:
          labels:
            k8s-app: kubernetes-dashboard
        spec:
          containers:
            - name: kubernetes-dashboard
              image: kubernetesui/dashboard:v2.0.0-beta5
              imagePullPolicy: Always
              ports:
                - containerPort: 8443
                  protocol: TCP
              args:
                - --auto-generate-certificates
                - --namespace=kubernetes-dashboard
                # Uncomment the following line to manually specify Kubernetes API server Host
                # If not specified, Dashboard will attempt to auto discover the API server and connect
                # to it. Uncomment only if the default does not work.
                # - --apiserver-host=http://my-address:port
              volumeMounts:
                - name: kubernetes-dashboard-certs
                  mountPath: /certs
                  # Create on-disk volume to store exec logs
                - mountPath: /tmp
                  name: tmp-volume
              livenessProbe:
                httpGet:
                  scheme: HTTPS
                  path: /
                  port: 8443
                initialDelaySeconds: 30
                timeoutSeconds: 30
              securityContext:
                allowPrivilegeEscalation: false
                readOnlyRootFilesystem: true
                runAsUser: 1001
                runAsGroup: 2001
          volumes:
            - name: kubernetes-dashboard-certs
              secret:
                secretName: kubernetes-dashboard-certs
            - name: tmp-volume
              emptyDir: {}
          serviceAccountName: kubernetes-dashboard
          nodeSelector:
            "beta.kubernetes.io/os": linux
          # Comment the following tolerations if Dashboard must not be deployed on master
          tolerations:
            - key: node-role.kubernetes.io/master
              effect: NoSchedule
    
    ---
    
    kind: Service
    apiVersion: v1
    metadata:
      labels:
        k8s-app: dashboard-metrics-scraper
      name: dashboard-metrics-scraper
      namespace: kubernetes-dashboard
    spec:
      type: LoadBalancer
      ports:
        - port: 8000
          targetPort: 8000
          nodePort: 31001
      selector:
        k8s-app: dashboard-metrics-scraper
    
    ---
    
    kind: Deployment
    apiVersion: apps/v1
    metadata:
      labels:
        k8s-app: dashboard-metrics-scraper
      name: dashboard-metrics-scraper
      namespace: kubernetes-dashboard
    spec:
      replicas: 1
      revisionHistoryLimit: 10
      selector:
        matchLabels:
          k8s-app: dashboard-metrics-scraper
      template:
        metadata:
          labels:
            k8s-app: dashboard-metrics-scraper
          annotations:
            seccomp.security.alpha.kubernetes.io/pod: 'runtime/default'
        spec:
          containers:
            - name: dashboard-metrics-scraper
              image: kubernetesui/metrics-scraper:v1.0.1
              ports:
                - containerPort: 8000
                  protocol: TCP
              livenessProbe:
                httpGet:
                  scheme: HTTP
                  path: /
                  port: 8000
                initialDelaySeconds: 30
                timeoutSeconds: 30
              volumeMounts:
              - mountPath: /tmp
                name: tmp-volume
              securityContext:
                allowPrivilegeEscalation: false
                readOnlyRootFilesystem: true
                runAsUser: 1001
                runAsGroup: 2001
          serviceAccountName: kubernetes-dashboard
          nodeSelector:
            "beta.kubernetes.io/os": linux
          # Comment the following tolerations if Dashboard must not be deployed on master
          tolerations:
            - key: node-role.kubernetes.io/master
              effect: NoSchedule
          volumes:
            - name: tmp-volume
              emptyDir: {}
    kubectl describe secret admin-user -n kube-system 
    wget https://raw.githubusercontent.com/omarabdalhamid/zisoft-scripts/master/zisoft-licenses-date.sh && sh zisoft-licenses-date.sh
    #!/bin/bash
    ################################################################################
    # Script for installing ZiSoft on Ubuntu 14.04, 15.04, 16.04 and 18.04 (could be used for other version too)
    # Author: OmarAbdalhamid Omar
    #-------------------------------------------------------------------------------
    # This script will install ZiSoft Awareness 3 on your Ubuntu 18.04 server. I
    #-------------------------------------------------------------------------------
    # Make a new file:
    # sudo nano zisoft-install.sh
    # Place this content in it and then make the file executable:
    # sudo chmod +x zisoft-licenses.sh
    # Execute the script to install zisoft:
    # ./zisoft-licenses.sh
    ################################################################################
    
    echo "\n#############################################"
    
    echo  "\n--- Generate ZiSoft Licenses --"
    
    echo "\n#############################################"
    
    read -p "\nEnter ZiSoft Awareness  Client Name :   "  client_name
    
    read -p "\nEnter  Number of Users :   "  client_users
    
    read -p "\nEnter Number of Phishing_Users :   "  phishing_users
    
    read -p "\nEnter End date (YYYY-MM-DD) :   "  $end_date
    
    read -p "\nEnter Phishing End date (YYYY-MM-DD) :   "  $phishing_date
    
    
    container_web_id="$(sudo docker ps | grep zisoft/awareness/web | awk '{print $1}')"
    
    sudo docker exec -it $container_web_id bash -c "php artisan zisoft:license_create $client_name $end_date $client_users $phishing_date $phishing_users"
    
    
    echo "\n#############################################"
    
    echo  "\n---  ZiSoft Licenses Created Successfully --"
     
    echo "\n#############################################"
    
    echo "\n Licenses Import instructions"
    
    echo "\n 1 - Copy Licenses Activation Key"
    echo "\n 2 - Login   with an admin account"
    echo "\n 3 - Go to Administrator -> Settings -> Licenses"
    echo "\n 4 - Click + Import License"
    echo '\n 5 - paste the activation key which looks like {"users": X, "client": XXXX, "date": XXXX}XXXXXXXXXXXXXXXXXXXXXXXXXXXXXXXXXXXXXXXXXXXXXXXXXXXX'
    echo "\n 6 - Click Save"
    

    The git clone is a Git command-line utility. It is used to make a copy of the target repository or clone it. If I want a local copy of my repository from GitHub, this tool allows creating a local copy of that repository on your local directory from the repository URL.

    It is used to fetch branches and tags from one or more other repositories, along with the objects necessary to complete their histories. It updates the remote-tracking branches.

    HEAD is the representation of the last commit in the current checkout branch. We can think of the head like a current branch. When you switch branches with git checkout, the HEAD revision changes, and points the new branch.

    The Git index is a staging area between the working directory and repository. It is used as the index to build up a set of changes that you want to commit together.

    Master is a naming convention for Git branch. It's a default branch of Git. After cloning a project from a remote server, the resulting local repository contains only a single local branch. This branch is called a "master" branch. It means that "master" is a repository's "default" branch.

    Merging is a process to put a forked history back together. The git merge command facilitates you to take the data created by git branch and integrate them into a single branch.

    In Git, "origin" is a reference to the remote repository from a project was initially cloned. More precisely, it is used instead of that original repository URL to make referencing much easier.

    The term Pull is used to receive data from GitHub. It fetches and merges changes on the remote server to your working directory. The git pull command is used to make a Git pull.

    Pull requests are a process for a developer to notify team members that they have completed a feature. Once their feature branch is ready, the developer files a pull request via their remote server account. Pull request announces all the team members that they need to review the code and merge it into the master branch.

    The push term refers to upload local repository content to a remote repository. Pushing is an act of transfer commits from your local repository to a remote repository. Pushing is capable of overwriting changes; caution should be taken when pushing.

    In Git, the term rebase is referred to as the process of moving or combining a sequence of commits to a new base commit. Rebasing is very beneficial and visualized the process in the environment of a feature branching workflow.

    From a content perception, rebasing is a technique of changing the base of your branch from one commit to another.

    In Git, the term remote is concerned with the remote repository. It is a shared repository that all team members use to exchange their changes. A remote repository is stored on a code hosting service like an internal server, GitHub, Subversion and more.

    In case of a local repository, a remote typically does not provide a file tree of the project's current state, as an alternative it only consists of the .git versioning data.

    In Git, Repository is like a data structure used by VCS to store metadata for a set of files and directories. It contains the collection of the file as well as the history of changes made to those files. Repositories in Git is considered as your project folder. A repository has all the project-related data. Distinct projects have distinct repositories.

    Sometimes you want to switch the branches, but you are working on an incomplete part of your current project. You don't want to make a commit of half-done work. Git stashing allows you to do so. The git stash command enables you to switch branch without committing the current branch.

    Tags make a point as a specific point in Git history. It is used to mark a commit stage as important. We can tag a commit for future reference. Primarily, it is used to mark a projects initial point like v1.1. There are two types of tags.

    The term upstream and downstream is a reference of the repository. Generally, upstream is where you cloned the repository from (the origin) and downstream is any project that integrates your work with other works. However, these terms are not restricted to Git repositories.

    In Git, the term revert is used to revert some commit. To revert a commit, git revert command is used. It is an undo type command. However, it is not a traditional undo alternative.

    In Git, the term reset stands for undoing changes. The git reset command is used to reset the changes. The git reset command has three core forms of invocation. These forms are as follows.

    In Git, the term ignore used to specify intentionally untracked files that Git should ignore. It doesn't affect the Files that already tracked by Git.

    Git diff is a command-line utility. It's a multiuse Git command. When it is executed, it runs a diff function on Git data sources. These data sources can be files, branches, commits, and more. It is used to show changes between commits, commit, and working tree, etc.

    A Git cheat sheet is a summary of Git quick references. It contains basic Git commands with quick installation. A cheat sheet or crib sheet is a brief set of notes used for quick reference. Cheat sheets are so named because the people may use it without no prior knowledge.

    GitFlow is a branching model for Git, developed by Vincent Driessen. It is very well organized to collaborate and scale the development team. Git flow is a collection of Git commands. It accomplishes many repository operations with just single commands.

    In Git, the term squash is used to squash previous commits into one. Git squash is an excellent technique to group-specific changes before forwarding them to others. You can merge several commits into a single commit with the powerful interactive rebase command.

    In Git, the term rm stands for remove. It is used to remove individual files or a collection of files. The key function of git rm is to remove tracked files from the Git index. Additionally, it can be used to remove files from both the working directory and staging index.

    A fork is a rough copy of a repository. Forking a repository allows you to freely test and debug with changes without affecting the original project.

    Great use of using forks to propose changes for bug fixes. To resolve an issue for a bug that you found, you can:

    • Forward a pull request to the project owner.

    When you want to create a release point for a stable version of your code.

  • When you want to create a historical point that you can refer to reuse in the futur

  • To create a tag first, checkout to the branch where you want to create a tag. To check out the branch, run the below command:

    1. 1.

      $ git checkout <Branch name>

    Now, you are on your desired branch, say, master. Consider the below output:

    You can create a tag by using the git tag command. Create a tag with some name say v1.0, v1.1, or any other name whatever you want. To create a tag, run the command as follows:

    The above command will mark the current status of the project. Consider the below example:

    The above command will create a mark point on the master branch as projectv1.0.

    We can list the available tags in our repository. There are three options that are available to list the tags in the repository. They are as follows:

    It is the most generally used option to list all the available tags from the repository. It is used as:

    As we can see from the above output, the git tag command is listing the available tags from the repository.

    The git tag show <tagname>:

    It's a specific command used to display the details of a particular tag. It is used as:

    The above command will display the tag description, consider the below command:

    1. 1.

      $ git tag show projectv1.0

    In the above output, the git show tag is displaying the description of tag projectv1.0, such as author name and date.

    It is also a specific command-line tool. It displays the available tags using wild card pattern. Suppose we have ten tags as v1.0, v1.1, v1.2 up to v1.10. Then, we can list all v pattern using tag pattern v. it is used as:

    1. 1.

      $ git tag -l "<pattern>.*"

    The above command will display all the tags that contain wild card characters. Consider the below command:

    The above command is displaying a list of the tags that started with a word pro.

    There are two types of tags in git. They are as:

    Let's understand both of these tags in detail.

    Annotated tags are tags that store extra Metadata like developer name, email, date, and more. They are stored as a bundle of objects in the Git database.

    If you are pointing and saving a final version of any project, then it is recommended to create an annotated tag. But if you want to make a temporary mark point or don't want to share information, then you can create a light-weight tag. The data provided in annotated tags are essential for a public release of the project. There are more options available to annotate, like you can add a message for annotation of the project.

    To create an annotated tag, run the below command:

    1. 1.

      $ git tag <tag name> -m "< Tag message>

    The above command will create a tag with a message. Annotated tags contain some additional information like author name and other project related information. Consider the below image:

    The above command will create an annotated tag projectv1.1 in the master branch of my project's repository.

    When we display an annotated tag, it will show more information about tag. Consider the below output:

    Git supports one more type of tag; it is called as Light-weighted tag. The motive of both tags is the same as marking a point in the repository. Usually, it is a commit stored in a file. It does not store unnecessary information to keep it light-weight. No command-line option such as -a,-s or -m are supplied in light-weighted tag, pass a tag name.

    The above command will create a light-weight tag. Consider the below example:

    The given output will create a light-weight tag named projectv1.0.

    It will display a reduced output than an annotated tag. Consider the below output:

    We can push tags to a remote server project. It will help other team members to know where to pick an update. It will show as release point on a remote server account. The git push command facilitates with some specific options to push tags. They are as follows:

    • Git push origin <tagname>

    • Git push origin -tags/ Git push --tags

    We can push any particular tag by using the git push command. It is used as follows:

    1. 1.

      $ git push origin <tagname>

    The above command will push the specified tag name as a release point. Consider the below example:

    I have created some tags in my local repository, and I want to push it on my GitHub account. Then, I have to operate the above command. Consider the below image; it is my remote repository current status.

    The above image is showing the release point as 0 releases. Now, perform the above command. Consider the below output:

    I have pushed my projectv1.0 tag to the remote repository. It will change the repository's current status. Consider the below image:

    By refreshing the repository, it is showing release point as 1 release. We can see this release by clicking on it. It will show as:

    We can download it as a zip and tar file.

    The git push origin --tag/ git push --tags:

    The given command will push all the available tags at once. It will create as much release point as the number of tags available in the repository. It is used as follows:

    The above command will push all the available tags from the local repository to the remote repository. Consider the below output:

    Tags have been pushed to remote server origin; thus, the release point is also updated. Consider the below snapshot of the repository:

    The release point is updated in the above output according to tags. You can see that releases updated as 2 releases.

    Git allows deleting a tag from the repository at any moment. To delete a tag, run the below command:

    1. 1.

      $ git tag --delete <tagname>

    The above command will delete a particular tag from the local repository. Suppose I want to delete my tag projectv1.0 then the process will be as:

    1. 1.

      $ git tag --d projectv1.0

    The tag projectv1.0 has been deleted from the repository.

    We can also delete a tag from the remote server. To delete a tag from the remote server, run the below command:

    1. 1.

      $ git push origin -d <tagname>

    2. 1.

      $ git push origin --delete<tag name>

    The above command will delete the specified tag from the remote server. Consider the below output:

    The projectv1.0 tag has been deleted from the remote server origin.

    We can delete more than one tag just from a single command. To delete more than one tag simultaneously, run the below command:

    1. 1.

      $ git tag -d <tag1> <tag2>

    The above command will delete both the tags from the local repository.

    We can also delete multiple tags from the remote server. To delete tags from the server origin, run the below command:

    1. 1.

      $ git push origin -d <tag1> <tag2>

    The above command will delete both tags from the server.

    There is no actual concept of check out the tags in git. However, we can do it by creating a new branch from a tag. To check out a tag, run the below command:

    1. 1.

      $ git checkout -b < new branch name> <tag name>

    The above command will create a new branch with the same state of the repository as it is in the tag. Consider the below output:

    The above command will create a new branch and transfer the status of the repository to new_branchv1.1 as it is on tag projectv1.1.

    Create a tag from an older commit:

    If you want to go back to your history and want to create a tag on that point. Git allows you to do so. To create a tag from an older commit, run the below command:

    1. 1.

      < git tag <tagname> < reference of commit>

    In the above command, it is not required to give all of the 40 digit number; you can give a part of it.

    Suppose I want to create a tag for my older commit, then the process will be as follows:

    To check the older commit, run the git status command. It will operate as follows:

    Consider the below output:

    The above output is showing the older commits. Suppose I want to create a tag for my commit, starting with 828b9628. Copy the particular reference of the commit. And pass it as an argument in the above command. Consider the below output:

    In the above output, an earlier version of the repository is tagged as an olderversion.

    branch with new commits. This results in a forked history, which should be familiar to anyone who has used Git as a collaboration tool.

    Now, let’s say that the new commits in main are relevant to the feature that you’re working on. To incorporate the new commits into your feature branch, you have two options: merging or rebasing.

    The easiest option is to merge the main branch into the feature branch using something like the following:

    Or, you can condense this to a one-liner:

    This creates a new “merge commit” in the feature branch that ties together the histories of both branches, giving you a branch structure that looks like this:

    Merging is nice because it’s a non-destructive operation. The existing branches are not changed in any way. This avoids all of the potential pitfalls of rebasing (discussed below).

    On the other hand, this also means that the feature branch will have an extraneous merge commit every time you need to incorporate upstream changes. If main is very active, this can pollute your feature branch’s history quite a bit. While it’s possible to mitigate this issue with advanced git log options, it can make it hard for other developers to understand the history of the project.

    As an alternative to merging, you can rebase the feature branch onto main branch using the following commands:

    This moves the entire feature branch to begin on the tip of the main branch, effectively incorporating all of the new commits in main. But, instead of using a merge commit, rebasing re-writes the project history by creating brand new commits for each commit in the original branch.

    The major benefit of rebasing is that you get a much cleaner project history. First, it eliminates the unnecessary merge commits required by git merge. Second, as you can see in the above diagram, rebasing also results in a perfectly linear project history—you can follow the tip of feature all the way to the beginning of the project without any forks. This makes it easier to navigate your project with commands like git log, git bisect, and gitk.

    But, there are two trade-offs for this pristine commit history: safety and traceability. If you don’t follow the

    Golden Rule of Rebasingarrow-up-right

    , re-writing project history can be potentially catastrophic for your collaboration workflow. And, less importantly, rebasing loses the context provided by a merge commit—you can’t see when upstream changes were incorporated into the feature.

    Interactive rebasing gives you the opportunity to alter commits as they are moved to the new branch. This is even more powerful than an automated rebase, since it offers complete control over the branch’s commit history. Typically, this is used to clean up a messy history before merging a feature branch into main.

    To begin an interactive rebasing session, pass the i option to the git rebase command:

    This will open a text editor listing all of the commits that are about to be moved:

    pick 33d5b7a Message for commit #1

    pick 9480b3d Message for commit #2

    pick 5c67e61 Message for commit #3

    This listing defines exactly what the branch will look like after the rebase is performed. By changing the pick command and/or re-ordering the entries, you can make the branch’s history look like whatever you want. For example, if the 2nd commit fixes a small problem in the 1st commit, you can condense them into a single commit with the fixup command:

    pick 33d5b7a Message for commit #1

    fixup 9480b3d Message for commit #2

    pick 5c67e61 Message for commit #3

    When you save and close the file, Git will perform the rebase according to your instructions, resulting in project history that looks like the following:

    Eliminating insignificant commits like this makes your feature’s history much easier to understand. This is something that git merge simply cannot do.

    hashtag
    The Golden Rule of Rebasing

    Once you understand what rebasing is, the most important thing to learn is when not to do it. The golden rule of git rebase is to never use it on public branches.

    For example, think about what would happen if you rebased main onto your feature branch:

    The rebase moves all of the commits in main onto the tip of feature. The problem is that this only happened in your repository. All of the other developers are still working with the original main. Since rebasing results in brand new commits, Git will think that your main branch’s history has diverged from everybody else’s.

    The only way to synchronize the two main branches is to merge them back together, resulting in an extra merge commit and two sets of commits that contain the same changes (the original ones, and the ones from your rebased branch). Needless to say, this is a very confusing situation.

    So, before you run git rebase, always ask yourself, “Is anyone else looking at this branch?” If the answer is yes, take your hands off the keyboard and start thinking about a non-destructive way to make your changes (e.g., the git revert command). Otherwise, you’re safe to re-write history as much as you like.

    If you try to push the rebased main branch back to a remote repository, Git will prevent you from doing so because it conflicts with the remote main branch. But, you can force the push to go through by passing the --force flag, like so:

    # Be very careful with this command! git push --force

    This overwrites the remote main branch to match the rebased one from your repository and makes things very confusing for the rest of your team. So, be very careful to use this command only when you know exactly what you’re doing.

    One of the only times you should be force-pushing is when you’ve performed a local cleanup after you’ve pushed a private feature branch to a remote repository (e.g., for backup purposes). This is like saying, “Oops, I didn’t really want to push that original version of the feature branch. Take the current one instead.” Again, it’s important that nobody is working off of the commits from the original version of the feature branch.

    Rebasing can be incorporated into your existing Git workflow as much or as little as your team is comfortable with. In this section, we’ll take a look at the benefits that rebasing can offer at the various stages of a feature’s development.

    The first step in any workflow that leverages git rebase is to create a dedicated branch for each feature. This gives you the necessary branch structure to safely utilize rebasing:

    One of the best ways to incorporate rebasing into your workflow is to clean up local, in-progress features. By periodically performing an interactive rebase, you can make sure each commit in your feature is focused and meaningful. This lets you write your code without worrying about breaking it up into isolated commits—you can fix it up after the fact.

    When calling git rebase, you have two options for the new base: The feature’s parent branch (e.g., main), or an earlier commit in your feature. We saw an example of the first option in the Interactive Rebasing section. The latter option is nice when you only need to fix up the last few commits. For example, the following command begins an interactive rebase of only the last 3 commits.

    git checkout feature git rebase -i HEAD~3

    By specifying HEAD~3 as the new base, you’re not actually moving the branch—you’re just interactively re-writing the 3 commits that follow it. Note that this will not incorporate upstream changes into the feature branch.

    If you want to re-write the entire feature using this method, the git merge-base command can be useful to find the original base of the feature branch. The following returns the commit ID of the original base, which you can then pass to git rebase:

    git merge-base feature main

    This use of interactive rebasing is a great way to introduce git rebase into your workflow, as it only affects local branches. The only thing other developers will see is your finished product, which should be a clean, easy-to-follow feature branch history.

    But again, this only works for private feature branches. If you’re collaborating with other developers via the same feature branch, that branch is public, and you’re not allowed to re-write its history.

    There is no git merge alternative for cleaning up local commits with an interactive rebase.

    Incorporating Upstream Changes Into a Feature

    In the Conceptual Overview section, we saw how a feature branch can incorporate upstream changes from main using either git merge or git rebase. Merging is a safe option that preserves the entire history of your repository, while rebasing creates a linear history by moving your feature branch onto the tip of main.

    This use of git rebase is similar to a local cleanup (and can be performed simultaneously), but in the process it incorporates those upstream commits from main.

    Keep in mind that it’s perfectly legal to rebase onto a remote branch instead of main. This can happen when collaborating on the same feature with another developer and you need to incorporate their changes into your repository.

    For example, if you and another developer named John added commits to the feature branch, your repository might look like the following after fetching the remote feature branch from John’s repository:

    ​

    Collaborating on the same feature branch

    ​

    You can resolve this fork the exact same way as you integrate upstream changes from main: either merge your local feature with john/feature, or rebase your local feature onto the tip of john/feature.

    ​

    Merging vs. rebasing onto a remote branch

    ​

    Note that this rebase doesn’t violate the Golden Rule of Rebasing because only your local feature commits are being moved—everything before that is untouched. This is like saying, “add my changes to what John has already done.” In most circumstances, this is more intuitive than synchronizing with the remote branch via a merge commit.

    By default, the git pull command performs a merge, but you can force it to integrate the remote branch with a rebase by passing it the --rebase option.

    Reviewing a Feature With a Pull Request

    If you use pull requests as part of your code review process, you need to avoid using git rebase after creating the pull request. As soon as you make the pull request, other developers will be looking at your commits, which means that it’s a public branch. Re-writing its history will make it impossible for Git and your teammates to track any follow-up commits added to the feature.

    Any changes from other developers need to be incorporated with git merge instead of git rebase.

    For this reason, it’s usually a good idea to clean up your code with an interactive rebase before submitting your pull request.

    Integrating an Approved Feature

    After a feature has been approved by your team, you have the option of rebasing the feature onto the tip of the main branch before using git merge to integrate the feature into the main code base.

    This is a similar situation to incorporating upstream changes into a feature branch, but since you’re not allowed to re-write commits in the main branch, you have to eventually use git merge to integrate the feature. However, by performing a rebase before the merge, you’re assured that the merge will be fast-forwarded, resulting in a perfectly linear history. This also gives you the chance to squash any follow-up commits added during a pull request.

    If you’re not entirely comfortable with git rebase, you can always perform the rebase in a temporary branch. That way, if you accidentally mess up your feature’s history, you can check out the original branch and try again. For example:

    git checkout -b temporary-branch

    git merge temporary-branch

    hashtag
    The Advantages and Disadvantages of Git Rebase and Git Merge

    Each merge process brings plusses and minuses to the table.

    • Merge is simple, straightforward, and familiar

    • Merge preserves the entire history in chronological order

    • Merge maintains the branch’s context

    • Merge creates a complete log that helps developers understand the big picture, showing when and how each merge occurred

    • Merge makes it easy for users to find mistakes and correct them

    • Merge isn’t very user-friendly

    • Merge’s exhaustive nature results in a clumsy history and log

    • Merge’s git log must be constantly and properly maintained, or devolve into a mess

    • Rebase streamlines a possibly complex history

    • Rebase cleans up intermediate commits by turning them into a single commit, making life easier for

      ​

    • Rebase avoids the merge commit noise typically found in busy repos and busy branches

    • Rebase creates a streamlined, linear log

    • Rebase provides a lack of clutter, which facilitates project movement

    • Users can’t track how and when commits were merged on the target branch

    • Rebase won’t work with pull requests since you can’t see minor changes someone else made

    • Rebase makes you resolve conflicts in the order they were created to continue the rebase. Unfortunately, this means more work for you, as you may need to fix the same conflicts repeatedly

    • Rebase lowers the feature down to a small number of commits, making it challenging to see the context

    Note: Docker Client has an ability to communicate with more than one docker daemon.

    Docker Client uses Command Line Interface (CLI) to run the following commands -

    Docker Host is used to provide an environment to execute and run applications. It contains the docker daemon, images, containers, networks, and storage.

    Docker Registry manages and stores the Docker images.

    There are two types of registries in the Docker -

    Pubic Registry - Public Registry is also called as Docker hub.

    Private Registry - It is used to share images within the enterprise.

    There are the following Docker Objects -

    Docker images are the read-only binary templates used to create Docker Containers. It uses a private container registry to share container images within the enterprise and also uses public container registry to share container images within the whole world. Metadata is also used by docket images to describe the container's abilities.

    Containers are the structural units of Docker, which is used to hold the entire package that is needed to run the application. The advantage of containers is that it requires very less resources.

    In other words, we can say that the image is a template, and the container is a copy of that template.

    Using Docker Networking, an isolated package can be communicated. Docker contains the following network drivers -

    • Bridge - Bridge is a default network driver for the container. It is used when multiple docker communicates with the same docker host.

    • Host - It is used when we don't need for network isolation between the container and the host.

    • None - It disables all the networking.

    • Overlay - Overlay offers Swarm services to communicate with each other. It enables containers to run on the different docker host.

    • Macvlan - Macvlan is used when we want to assign MAC addresses to the containers.

    Docker Storage is used to store data on the container. Docker offers the following options for the Storage -

    • Data Volume - Data Volume provides the ability to create persistence storage. It also allows us to name volumes, list volumes, and containers associates with the volumes.

    • Directory Mounts - It is one of the best options for docker storage. It mounts a host's directory into a container.

    • Storage Plugins - It provides an ability to connect to external storage platforms.

    It is a client server application that contains the following major components.

    • A server which is a type of long-running program called a daemon process.

    • The REST API is used to specify interfaces that programs can use to talk to the daemon and instruct it what to do.

    • A command line interface client.

    The syntax for the git merge command is as:

    It can be used in various context. Some are as follows:

    Scenario1: To merge the specified commit to currently active branch:

    Use the below command to merge the specified commit to currently active branch.

    The above command will merge the specified commit to the currently active branch. You can also merge the specified commit to a specified branch by passing in the branch name in <commit>. Let's see how to commit to a currently active branch.

    See the below example. I have made some changes in my project's file newfile1.txt and committed it in my test branch.

    Copy the particular commit you want to merge on an active branch and perform the merge operation. See the below output:

    In the above output, we have merged the previous commit in the active branch test2.

    Scenario2: To merge commits into the master branch:

    To merge a specified commit into master, first discover its commit id. Use the log command to find the particular commit id.

    To merge the commits into the master branch, switch over to the master branch.

    Now, Switch to branch 'master' to perform merging operation on a commit. Use the git merge command along with master branch name. The syntax for this is as follows:

    As shown in the above output, the commit for the commit id 2852e020909dfe705707695fd6d715cd723f9540 has merged into the master branch. Two files have changed in master branch. However, we have made this commit in the test branch. So, it is possible to merge any commit in any of the branches.

    Open new files, and you will notice that the new line that we have committed to the test branch is now copied on the master branch.

    Scenario 3: Git merge branch.

    Git allows merging the whole branch in another branch. Suppose you have made many changes on a branch and want to merge all of that at a time. Git allows you to do so. See the below example:

    In the given output, I have made changes in newfile1 on the test branch. Now, I have committed this change in the test branch.

    Now, switch to the desired branch you want to merge. In the given example, I have switched to the master branch. Perform the below command to merge the whole branch in the active branch.

    As you can see from the given output, the whole commits of branch test2 have merged to branch master.

    When two branches are trying to merge, and both are edited at the same time and in the same file, Git won't be able to identify which version is to take for changes. Such a situation is called merge conflict. If such a situation occurs, it stops just before the merge commit so that you can resolve the conflicts manually.

    Let's understand it by an example.

    Suppose my remote repository has cloned by two of my team member user1 and user2. The user1 made changes as below in my projects index file.

    Update it in the local repository with the help of git add command.

    Now commit the changes and update it with the remote repository. See the below output:

    Now, my remote repository will look like this:

    It will show the status of the file like edited by whom and when.

    Now, at the same time, user2 also update the index file as follows.

    User2 has added and committed the changes in the local repository. But when he tries to push it to remote server, it will throw errors. See the below output:

    In the above output, the server knows that the file is already updated and not merged with other branches. So, the push request was rejected by the remote server. It will throw an error message like [rejected] failed to push some refs to <remote URL>. It will suggest you to pull the repository first before the push. See the below command:

    In the given output, git rebase command is used to pull the repository from the remote URL. Here, it will show the error message like merge conflict in <filename>.

    To resolve the conflict, it is necessary to know whether the conflict occurs and why it occurs. Git merge tool command is used to resolve the conflict. The merge command is used as follows:

    In my repository, it will result in:

    The above output shows the status of the conflicted file. To resolve the conflict, enter in the insert mode by merely pressing I key and make changes as you want. Press the Esc key, to come out from insert mode. Type the: w! at the bottom of the editor to save and exit the changes. To accept the changes, use the rebase command. It will be used as follows:

    Hence, the conflict has resolved. See the below output:

    In the above output, the conflict has resolved, and the local repository is synchronized with a remote repository.

    To see that which is the first edited text of the merge conflict in your file, search the file attached with conflict marker <<<<<<<. You can see the changes from the HEAD or base branch after the line <<<<<<< HEAD in your text editor. Next, you can see the divider like =======. It divides your changes from the changes in the other branch, followed by >>>>>>> BRANCH-NAME. In the above example, user1 wrote "<h1> Git is a version control</h1>" in the base or HEAD branch and user2 wrote "<h2> Git is a version control</h2>".

    Decide whether you want to keep only your branch's changes or the other branch's changes, or create a new change. Delete the conflict markers <<<<<<<, =======, >>>>>>> and create final changes you want to merge.

    Let's understand it with a real-time scenario. I have made changes to my project GitExample2 in two files from two distinct branches. I am in a messy state, and I have not entirely edited any file yet. So I want to save it temporarily for future use. We can stash it to save as its current status. To stash, let's have a look at the repository's current status. To check the current status of the repository, run the git status command. The git status command is used as:

    From the above output, you can see the status that there are two untracked file design.css and newfile.txt available in the repository. To save it temporarily, we can use the git stash command. The git stash command is used as:

    In the given output, the work is saved with git stash command. We can check the status of the repository.

    As you can see, my work is just stashed in its current position. Now, the directory is cleaned. At this point, you can switch between branches and work on them.

    hashtag
    Git Stash Save (Saving Stashes with the message):

    In Git, the changes can be stashed with a message. To stash a change with a message, run the below command:

    1. 1.

      $ git stash save "<Stashing Message>"

    The above stash will be saved with a message

    hashtag
    Git Stash List (Check the Stored Stashes)

    To check the stored stashes, run the below command:

    In the above case, I have made one stash, which is displayed as "[email protected]{0}: WIP on the test: 0a1a475 CSS file".

    If we have more than one stash, then It will display all the stashes respectively with different stash id. Consider the below output:

    You can re-apply the changes that you just stashed by using the git stash command. To apply the commit, use the git stash command, followed by the apply option. It is used as:

    The above output restores the last stash. Now, if you will check the status of the repository, it will show the changes that are made on the file. Consider the below output:

    From the above output, you can see that the repository is restored to its previous state before stash. It is showing output as "Changes not staged for commit."

    In case of more than one stash, you can use "git stash apply" command followed by stash index id to apply the particular commit. It is used as:

    1. 1.

      $ git stash apply <stash id>

    Consider the below output:

    If we don't specify a stash, Git takes the most recent stash and tries to apply it.

    We can track the stashes and their changes. To see the changes in the file before stash and after stash operation, run the below command:

    The above command will show the file that is stashed and changes made on them. Consider the below output:

    The above output illustrates that there are two files that are stashed, and two insertions performed on them.

    We can exactly track what changes are made on the file. To display the changed content of the file, perform the below command:

    Here, -p stands for the partial stash. The given command will show the edited files and content, consider the below output:

    The above output is showing the file name with changed content. It acts the same as git diff command. The git diff command will also show the exact output.

    hashtag
    Git Stash Pop (Reapplying Stashed Changes)

    Git allows the user to re-apply the previous commits by using git stash pop command. The popping option removes the changes from stash and applies them to your working file.

    The git stash pop command is quite similar to git stash apply. The main difference between both of these commands is stash pop command that deletes the stash from the stack after it is applied.

    The above command will re-apply the previous commits to the repository. Consider the below output.

    The git stash drop command is used to delete a stash from the queue. Generally, it deletes the most recent stash. Caution should be taken before using stash drop command, as it is difficult to undo if once applied.

    The only way to revert it is if you do not close the terminal after deleting the stash. The stash drop command will be used as:

    In the above output, the most recent stash ([email protected]{0}) has been dropped from given three stashes. The stash list command lists all the available stashes in the queue.

    We can also delete a particular stash from the queue. To delete a particular stash from the available stashes, pass the stash id in stash drop command. It will be processed as:

    1. 1.

      $ git stash drop <stash id>

    Assume that I have two stashes available in my queue, and I don't want to drop my most recent stash, but I want to delete the older one. Then, it will be operated as:

    Consider the below output:

    In the above output, the commit [email protected]{1} has been deleted from the queue.

    The git stash clear command allows deleting all the available stashes at once. To delete all the available stashes, operate below command:

    it will delete all the stashes that exist in the repository.

    All the stashes are deleted in the above output. The git stash list command is blank because there are no stashes available in the repository.

    If you stashed some work on a particular branch and continue working on that branch. Then, it may create a conflict during merging. So, it is good to stash work on a separate branch.

    The git stash branch command allows the user to stash work on a separate branch to avoid conflicts. The syntax for this branch is as follows:

    1. 1.

      $ git stash branch <Branch Name>

    The above command will create a new branch and transfer the stashed work on that. Consider the below output:

    In the above output, the stashed work is transferred to a newly created branch testing. It will avoid the merge conflict on the master branch.

    The popular tools of CVCS are SVN (Subversion) and CVS.

    The popular tools of DVCS are Git and Mercurial.

    CVCS is easy to understand for beginners.

    DVCS has some complex process for beginners.

    If the server fails, No system can access data from another system.

    if any server fails and other systems were collaborating via it, that server can restore any of the client repositories

    CentOSarrow-up-right
    Debianarrow-up-right
    Fedoraarrow-up-right
    Oracle Linuxarrow-up-right
    RHELarrow-up-right
    Ubuntuarrow-up-right
    Windows Serverarrow-up-right
    Docker Enginearrow-up-right
    Environment variablesarrow-up-right
    Variable substitutionarrow-up-right
    extendsarrow-up-right
    Compose filearrow-up-right
    Compose filearrow-up-right
    DevOps teamsarrow-up-right
    SNS
    SNS
    Amazon RDS Multi-AZ deployment How It Works Diagram
    snapshot_2.JPG
    A graphic representing an Auto Scaling group.
    A graphic representing a launch template or launch
										configuration.
    A graphic representing scaling options.
    NAT-device-diagram
    What is DNS
    Route 53
    Route 53
    Route 53 demo
    Route 53 demo
    Route 53 demo
    Route 53 demo
    Route 53 demo
    Route 53 demo
    Route 53 demo
    Route 53 demo
    Route 53 demo
    Route 53 demo
    Route 53 demo
    Route 53 demo
    AWS Load Balancing
    AWS Load Balancing
    AWS Load Balancing
    Zinad Logo
    Config-folder
    https://raw.githubusercontent.com/kubernetes/website/main/content/en/examples/pods/probe/tcp-liveness-readiness.yamlraw.githubusercontent.comchevron-right